

Nifty 50 and Bank Nifty Daily Outlook for July 2, 2025
 01-Jul-2025
 2 mins read
Author
.jpg)

Trending Now
-

Turtlemint Fintech Solutions IPO GMP, Open Date, Price Band, Issue Size 18-Jun-2026
-
.jpg)
SpaceX IPO: Elon Musk Becomes World's First Trillionaire — Key Facts Explained 13-Jun-2026
-

Zepto IPO, Open Date, Issue Size, Price Band and UDRHP Filed 12-Jun-2026
-

Shah Metacorp Rights Issue May 2026 Details, Record Date, Issue Price 26-May-2026
-

Jio Is Going Public. Here's What That Actually Means for You 11-May-2026
-

Parle Products IPO: India’s Most Iconic Biscuit Brand Going Public? 30-Apr-2026
-
Gujarat Cotex Rights Issue 2026 Details, Record Date, Issue Price 27-Mar-2026
-
.jpg)
Avi Polymers Rights Issue 2026 Details, Record Date, Issue Price 11-Feb-2026
-

D & H India Rights Issue 2026 Details, Record Date, Issue Price 05-Feb-2026
-

Avasara Finance Rights Issue 2025 Details, Record Date, Issue Price 29-Dec-2025


Nifty 50 and Bank Nifty Daily Outlook for July 2, 2025
Nifty 50 and Bank Nifty sustain gains above key moving averages on daily and weekly charts. Positive momentum from RSI, MACD, and ROC is offset by overbought Stochastic and Williams %R readings, suggesting near‑term caution. Nifty 50 faces resistance at 25,669 with support near 25,437, while Bank Nifty eyes 57,920 resistance and 57,150 support. Breakouts could spark fresh upside, but consolidation remains likely.
Nifty 50 Today: Performance, Price & Outlook
Today Nifty 50 Movement & Index Nifty 50 Update
Nifty 50 remains in a bullish structure despite Monday’s mild decline, closing at 25,541.80. The daily and weekly charts both display higher highs and sustained momentum above key moving averages, reinforcing the broader Nifty 50 outlook. From a Nifty 50 overview standpoint, momentum indicators—RSI at 64.29, MACD, CCI and ROC—all retain bullish readings, although the Stochastic and Williams %R are in overbought zones, hinting at possible short‑term exhaustion.
Price is consolidating just below resistance at 25,669 (Fibonacci 78.6% retracement). A decisive break and hold above this level would shift the Nifty 50 price action toward R2 at 25,749 and then R3 at 25,829. However, a weak trend strength (ADX at 20.55) and low volatility (ATR: 242) suggest potential sideways action before any sustained move. This Nifty 50 outlook factors in both the bullish chart structure and the caution warranted by overbought oscillators.
In summary, the Nifty 50 overview highlights a resilient uptrend, while the Nifty 50 price consolidates near its resistance level. If momentum firms, the Nifty 50 outlook remains constructive—yet traders should monitor overbought readings and watch for a clear breach of 25,669 to confirm further upside in Nifty 50 price.
Nifty 50 Chart Today
Nifty 50 chart today
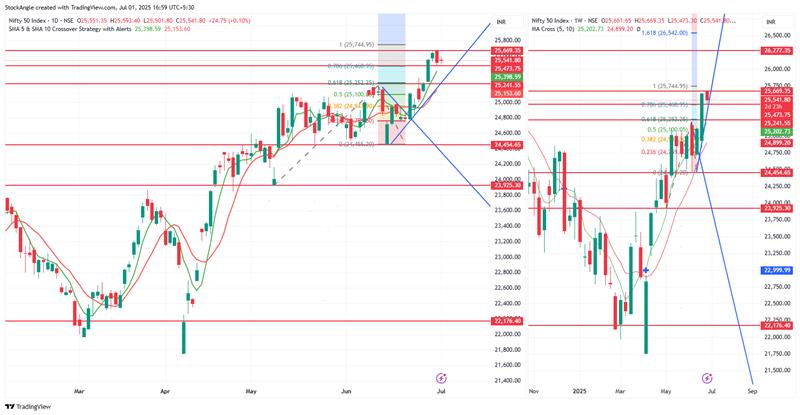
The Nifty 50 chart shows a decisive breakout above 25,744, confirming bullish momentum in the Nifty 50 daily chart. On the Nifty 50 live chart, moving average crossovers and Fibonacci extensions target 26,542, while the Nifty 50 chart signals support at 25,475 and 24,465. The Nifty 50 daily chart and Nifty 50 live chart together guide traders to anticipate pullbacks. Check the Nifty 50 chart to fine‑tune your strategy.
Nifty 50 Technical Indicator Summary
|
Indicator |
Value |
Action |
|
RSI(14) |
64.29 |
Bullish |
|
MACD(12,26,9) |
229.43 |
Bullish |
|
Stochastic(20,3) |
89.34 |
Overbought |
|
ROC(20) |
4.07 |
Bullish |
|
CCI(20) |
137.36 |
Bullish |
|
Williamson%R(14) |
-10.66 |
Overbought |
|
ATR(14) |
242.35 |
Low Volatility |
|
ADX(14) |
20.55 |
|
|
UB: 25,649.88 |
||
|
LB: 24,485.53 |
Nifty 50 Support and Resistance Levels
|
Type |
R1 |
R2 |
R3 |
Pivot Point |
S1 |
S2 |
S3 |
|
Classic |
25633.17 |
25749.28 |
25829.22 |
25553.23 |
25437.12 |
25357.18 |
25241.07 |
Nifty 50 forecast for tomorrow
For tomorrow’s Nifty forecast, expect range-bound trading between 25,437 and 25,669. The Nifty forecast indicates that a decisive breakout above 25,700 could open room toward 26,000+ levels in the coming week. According to our Nifty forecast, downside support rests near 25,200–25,100.
Bank Nifty Today: Price Action & Forecast
Today Bank Nifty Movement & Index Bank Nifty Update
Today Bank Nifty continues to display strong bullish momentum, as evident from both the daily and weekly charts. The Bank Nifty Price closed at 57,459.45, comfortably above key moving averages, with bullish crossovers across short, medium, and long‑term timeframes.
Today Bank Nifty’s indicators—RSI (66.31), MACD, and ROC—suggest sustained upward pressure, though Stochastic and Williams %R signal overbought conditions. The Bank Nifty Price is approaching the Fibonacci 78.6% retracement level (57,920), a potential resistance. If breached, R2 (57,794) and R3 (57,974) targets come into play. Today Bank Nifty traders should note ADX (23.73) and low ATR, hinting at consolidation or mild pullbacks. The Bank Nifty Price outlook remains cautiously optimistic.
Bank Nifty Chart Today
Bank Nifty chart today
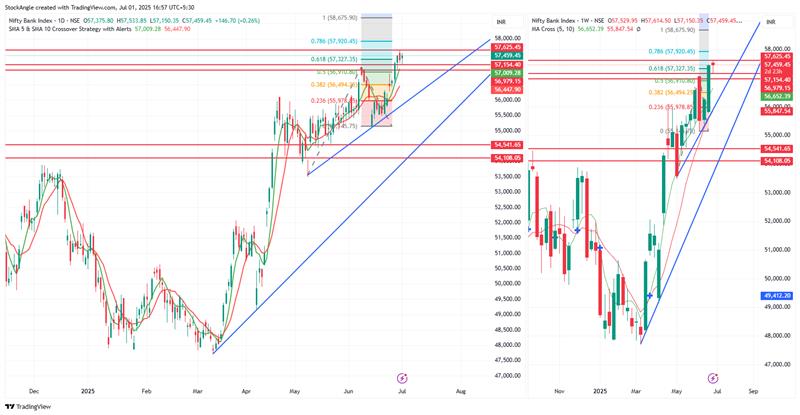
The Bank Nifty chart depicts a robust uptrend, with price breaking above the 0.786 Fibonacci level around 57,072. The Bank Nifty daily chart highlights sustained bullish momentum as moving averages cross over, targeting highs near 58,675. Support levels on the Bank Nifty chart sit at 56,100 and 54,140. Traders monitoring the Bank Nifty daily chart can use trendline support and Fibonacci retracements to manage risk and optimize entries for better decisions.
Bank Nifty Technical Indicator Summary
|
Indicator |
Level |
Indication |
|
RSI(14) |
66.31 |
Bullish |
|
MACD(12,26,9) |
531.64 |
Bullish |
|
Stochastic(20,3) |
92.68 |
Overbought |
|
ROC(20) |
3.3 |
Bullish |
|
CCI(20) |
130.17 |
Bullish |
|
Williamson%R(14) |
-7.32 |
Overbought |
|
ATR(14) |
570.34 |
Low Volatility |
|
ADX(14) |
23.73 |
Weak Trend |
|
Bollinger Band(20,2) |
UB: 57,601.18 |
|
|
LB: 55,140.06 |
||
|
SMA20 : 56,370.62 |
Bank Nifty Support and Resistance Levels
|
Type |
R1 |
R2 |
R3 |
Pivot Point |
S1 |
S2 |
S3 |
|
Classic |
57553.57 |
57794.38 |
57974.27 |
57373.68 |
57132.87 |
56952.98 |
56712.17 |
Bank Nifty forecast for tomorrow:
The Bank Nifty forecast for tomorrow suggests range‑bound movement between 57,150 and 57,800. In this Bank Nifty forecast, a sustained breakout above 57,800 could trigger fresh upside momentum, while failure to break out may keep prices oscillating within the range. Looking at the broader Bank Nifty forecast for the coming week, 56,650 (weekly SMA20) will be a crucial support—any breach here could lead to deeper consolidation or a pullback.
Short-Term Outlook & Strategy
Nifty 50 and Bank Nifty maintain bullish structures across daily and weekly charts, underpinned by strong moving‑average crossovers and positive momentum indicators. Resistance at 25,669 for Nifty 50 and 57,920 for Bank Nifty may test short‑term strength, while overbought oscillators caution against exhaustion. Key supports—25,437/25,200 on Nifty 50 and 57,150/56,650 on Bank Nifty—are critical. A clear breakout above resistance levels could drive renewed upside, otherwise expect consolidation.
RA Disclaimer: The information provided here is for educational and informational purposes only and should not be construed as investment advice. You are solely responsible for conducting your research and due diligence before making financial decisions.