

Nifty 50 and Bank Nifty Daily Outlook for July 1, 2025
 30-Jun-2025
 2 mins read
Author
.jpg)

Trending Now
-

Turtlemint Fintech Solutions IPO GMP, Open Date, Price Band, Issue Size 18-Jun-2026
-
.jpg)
SpaceX IPO: Elon Musk Becomes World's First Trillionaire — Key Facts Explained 13-Jun-2026
-

Zepto IPO, Open Date, Issue Size, Price Band and UDRHP Filed 12-Jun-2026
-

Shah Metacorp Rights Issue May 2026 Details, Record Date, Issue Price 26-May-2026
-

Jio Is Going Public. Here's What That Actually Means for You 11-May-2026
-

Parle Products IPO: India’s Most Iconic Biscuit Brand Going Public? 30-Apr-2026
-
Gujarat Cotex Rights Issue 2026 Details, Record Date, Issue Price 27-Mar-2026
-
.jpg)
Avi Polymers Rights Issue 2026 Details, Record Date, Issue Price 11-Feb-2026
-

D & H India Rights Issue 2026 Details, Record Date, Issue Price 05-Feb-2026
-

Avasara Finance Rights Issue 2025 Details, Record Date, Issue Price 29-Dec-2025


Nifty 50 and Bank Nifty Daily Outlook for July 1, 2025
India’s equity markets exhibit robust bullish momentum, with the Nifty 50 breaking key resistance and consolidating firmly above 25,400, while Bank Nifty sustains its uptrend near 57,300. Low volatility and healthy moving‑average crossovers underpin the rally, though overbought technicals signal potential short‑term pauses. Overall, strong domestic liquidity, resilient corporate earnings, and positive market breadth support further upside, with pullbacks offering strategic entry points amid an enduring risk‑on backdrop.
Nifty 50 Today: Performance, Price & Outlook
Today Nifty 50 Movement & Index Nifty 50 Update
Nifty 50 live shows strong bullish momentum, closing at a Nifty 50 price of 25,517 despite a minor decline of 0.47%. The daily chart suggests consolidation after a recent breakout above 25,241, with resistance at 25,600 (Bollinger Band UB and Fibonacci level).
Traders tracking Nifty 50 live can monitor Nifty 50 price levels to gauge momentum, noting indicators like RSI (63.83), MACD, ROC, and CCI remain bullish. The Nifty 50 price action also reveals short‑term overbought conditions, with Stochastic and Williams %R signaling caution, even as the weekly view confirms structural strength above key Fibonacci retracements.
Meanwhile, the Nifty 50 live feed highlights that all moving‑average crossovers across timeframes remain bullish, although ADX at 19.38 suggests the trend lacks strength and ATR points to low volatility.
Nifty 50 Chart Today
Nifty 50 chart today
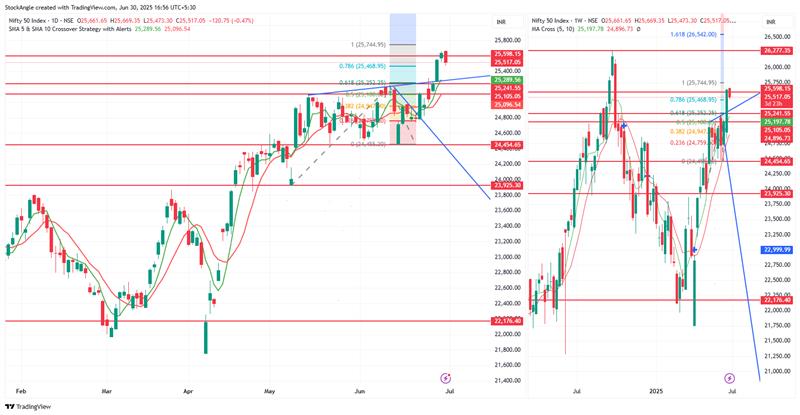
Looking at the Nifty 50 chart reveals a bullish breakout above resistance, supported by volume expansion on the Nifty 50 chart. The Nifty 50 daily chart emphasizes a clear uptrend with higher highs and higher lows, confirming momentum. Traders analyzing the Nifty 50 chart should note Fibonacci retracement levels and trendline support. Moreover, the Nifty 50 daily chart indicates potential consolidation near 25,400–25,800. The Nifty 50 chart confirms upside bias.
Nifty 50 Technical Indicator Summary
|
Indicator |
Value |
Action |
|
RSI(14) |
63.83 |
Bullish |
|
MACD(12,26,9) |
219.09 |
Bullish |
|
Stochastic(20,3) |
87.23 |
Overbought |
|
ROC(20) |
3.24 |
Bullish |
|
CCI(20) |
160.54 |
Bullish |
|
Williamson%R(14) |
-12.77 |
Overbought |
|
ATR(14) |
253.95 |
Low Volatility |
|
ADX(14) |
19.38 |
|
|
UB : 25,600.00 |
||
|
LB : 24,435.43 |
Nifty 50 Support and Resistance Levels
|
Type |
R1 |
R2 |
R3 |
Pivot Point |
S1 |
S2 |
S3 |
|
Classic |
25686.82 |
25735.83 |
25817.47 |
25605.18 |
25556.17 |
25474.53 |
25425.52 |
Nifty 50 forecast for tomorrow
Nifty 50 may test resistance near 25,686–25,744 as per the analyst for the Nifty 50 forecast for tomorrow. A breakout could lead to 26,000+, while a pullback may find support near 25,100–25,289. Meanwhile the forecast for Nifty 50 suggests a sideways to slightly bullish bias unless volatility climbs.
Bank Nifty Today: Price Action & Forecast
Today Bank Nifty Movement & Index Bank Nifty Update
Today Bank Nifty ended slightly lower at a Bank Nifty Price of 57,312.75, showing signs of consolidation just below resistance at 57,450 (Bollinger UB & Fibonacci 78.6%). In our view of Today Bank Nifty action, the daily chart indicates a strong bullish structure supported by higher lows and sustained price above short‑term moving averages.
Yet, overbought readings in Stochastic (87.76) and Williams %R (–12.24) suggest short‑term exhaustion. Weekly momentum remains robust, and moving‑average crossovers across all timeframes stay bullish.
With the Bank Nifty Price volatility low (ATR: 584.71) and trend strength moderate (ADX: 22.55), Today Bank Nifty appears poised for a mild pullback or range‑bound trade before resuming its uptrend. Monitoring the Bank Nifty Price near support levels will be key to gauge next moves.
Bank Nifty Chart Today
Bank Nifty chart today
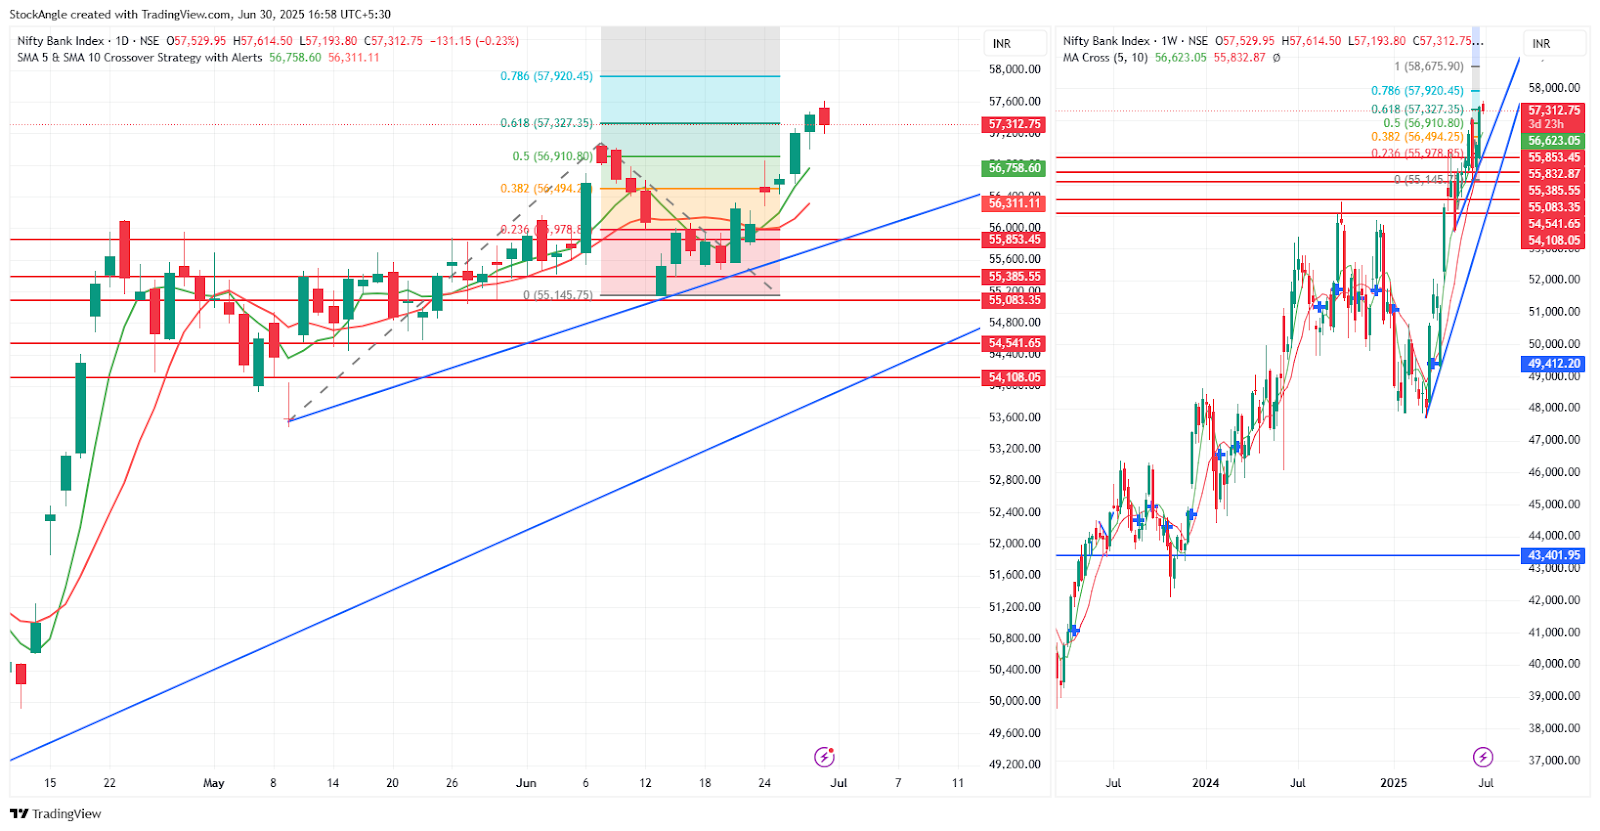
The Bank Nifty chart shows a strong May‑to‑July uptrend, breaking key Fibonacci resistance on the Bank Nifty Daily chart. On the Bank Nifty Daily chart, price consolidates between 56,758 and 57,920 above the trendline. Traders using the Bank Nifty chart can apply moving average crossovers on the Bank Nifty Daily chart for signals. The Bank Nifty chart confirms bullish momentum, while the Bank Nifty Daily chart view supports upside bias.
Bank Nifty Technical Indicator Summary
|
Indicators |
Value |
Action |
|
RSI(14) |
65.32 |
Bullish |
|
MACD(12,26,9) |
501.7 |
Bullish |
|
Stochastic(20,3) |
87.76 |
Overbought |
|
ROC(20) |
2.52 |
Bullish |
|
CCI(20) |
151.08 |
Bullish |
|
Williamson%R(14) |
-12.24 |
Overbought |
|
ATR(14) |
584.71 |
Low Volatility |
|
ADX(14) |
22.55 |
Weak Trend |
|
Bollinger Band(20,2) |
UB : 57,450.76 |
|
|
LB : 55,107.06 |
||
|
SMA20 : 56,278.91 |
Bank Nifty Support and Resistance Levels
|
Type |
R1 |
R2 |
R3 |
Pivot Point |
S1 |
S2 |
S3 |
|
Classic |
25686.82 |
25735.83 |
25817.47 |
25605.18 |
25556.17 |
25474.53 |
25425.52 |
Bank Nifty forecast for tomorrow:
Our latest Bank Nifty Forecast suggests the index could test resistance at 57,600–57,785 (R1/R2 levels) before a potential breakout toward 58,096–58,675. In this Bank Nifty Forecast for Tomorrow, we expect any profit booking to find support at 56,278 (SMA20) and 55,853, signaling a mild upward bias with consolidation. The Bank Nifty Forecast highlights that sustained buying above 57,785 would confirm bullish momentum, while a dip below 56,278 in tomorrow’s Bank Nifty Forecast for Tomorrow could trigger deeper pullbacks. Overall, Bank Nifty Forecast for Tomorrow emphasizes limited volatility and continued upside bias this week.
Short-Term Outlook & Strategy
Nifty 50’s recent breakout and consolidation around 25,400–25,800 confirm underlying bullish momentum, despite short‑term overbought signals and moderate trend strength. Similarly, Bank Nifty’s uptrend remains intact near 57,312, supported by moving‑average crossovers and low volatility, although near‑term exhaustion warns of a potential range‑bound phase.
Overall, both indices are poised to probe higher resistance levels, with pullbacks offering measured entry points amid sustained upward momentum and continued resilience.
RA Disclaimer: The information provided here is for educational and informational purposes only and should not be construed as investment advice. You are solely responsible for conducting your research and due diligence before making financial decisions.