

Where Will Nifty 50 And Bank Nifty Move On June 25,2025?
 24-Jun-2025
 2 mins read
Trending Now
-

Turtlemint Fintech Solutions IPO GMP, Open Date, Price Band, Issue Size 18-Jun-2026
-
.jpg)
SpaceX IPO: Elon Musk Becomes World's First Trillionaire — Key Facts Explained 13-Jun-2026
-

Zepto IPO, Open Date, Issue Size, Price Band and UDRHP Filed 12-Jun-2026
-

Shah Metacorp Rights Issue May 2026 Details, Record Date, Issue Price 26-May-2026
-

Jio Is Going Public. Here's What That Actually Means for You 11-May-2026
-

Parle Products IPO: India’s Most Iconic Biscuit Brand Going Public? 30-Apr-2026
-
Gujarat Cotex Rights Issue 2026 Details, Record Date, Issue Price 27-Mar-2026
-
.jpg)
Avi Polymers Rights Issue 2026 Details, Record Date, Issue Price 11-Feb-2026
-

D & H India Rights Issue 2026 Details, Record Date, Issue Price 05-Feb-2026
-

Avasara Finance Rights Issue 2025 Details, Record Date, Issue Price 29-Dec-2025


Nifty 50 & Bank Nifty Outlook: Live Key Levels for June 25, 2025
Nifty 50 trades within a robust uptrend at 25,044, with all DMA crossovers bullish. A breakout above 25,105–25,183 targets 25,309+, while support sits at 24,845. Bank Nifty’s bullish momentum extends beyond 56,462, surpassing R1 and eyeing 56,723+ above 56,478, with support at 56,024 and 55,814. Despite a modest ADX, high ATR underpins sharp moves, making both indices poised for further upside barring downside violation. Watch key levels closely this week.
Where Will Nifty 50 Move On June 25,2025?
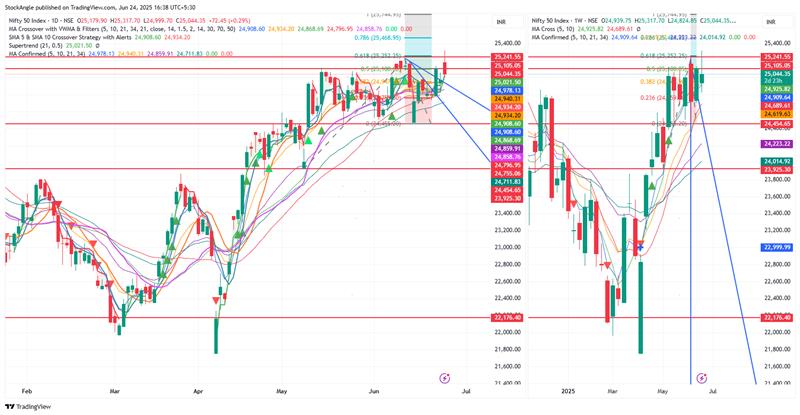
Nifty 50 remains in a strong bullish structure, closing at 25,044.35—just below immediate resistance at 25,077.65. All key moving average crossovers (5/20, 20/50, 50/200 DMA) signal a continued uptrend.
|
Period |
Moving Average Crossover |
Indication |
|
Short Term |
5 DMA & 20 DMA |
Bullish |
|
Medium Term |
20 DMA & 50 DMA |
Bullish |
|
Long Term |
50 DMA & 200 DMA |
Bullish |
Momentum indicators like RSI, MACD, and CCI are firmly bullish, and the price is consolidating just below a major breakout zone near the 0.618 Fibonacci level (25,252). Despite low ADX indicating a weak trend strength, high volatility (ATR: 267) supports sharp moves.
|
Indicator |
Level |
Indication |
|
RSI (14) |
59.21 |
Bullish |
|
MACD (12, 26, 9) |
320.59 |
Bullish |
|
Stochastic (20, 3) |
69.91 |
Bullish |
|
ROC (20) |
2 |
Bullish |
|
CCI (20) |
106.22 |
Bullish |
|
Williams %R (14) |
–30.92 |
Bullish |
|
ATR (14) |
624.62 |
Low Volatility |
|
ADX (14) |
18.17 |
Weak Trend |
|
Bollinger Band (20, 2) |
UB: 56,802.96 LB: 55,158.03 SMA 20: 55,980.50 |
— |
If Nifty breaks above 25,105–25,183, it could rally toward 25,309+. Immediate support lies at 24,845.
Where Will Bank Nifty Move On June 25, 2025?
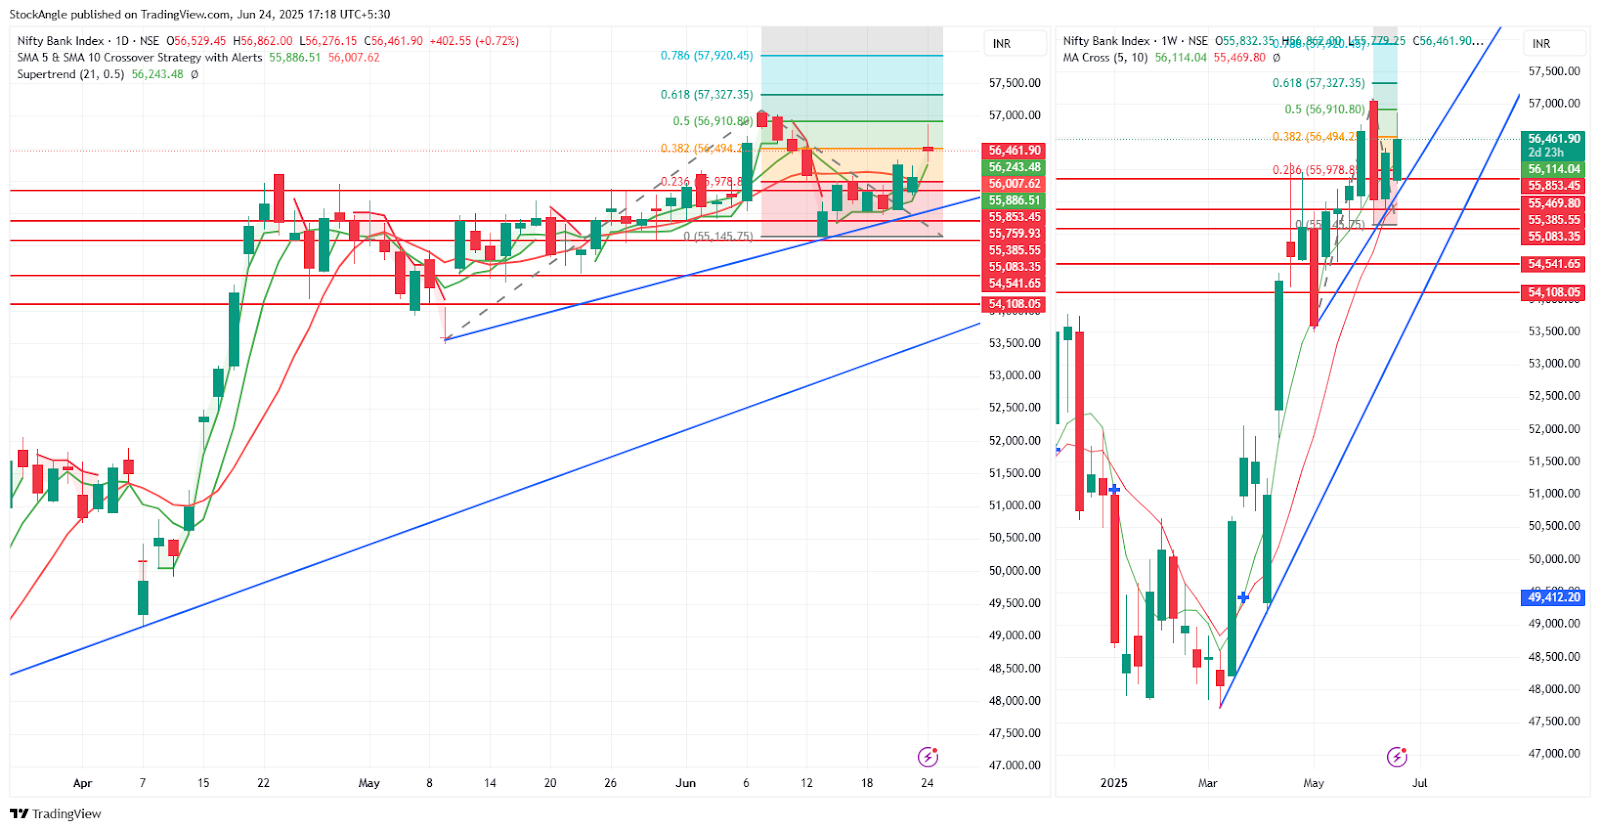
Bank Nifty closed at 56,461.90, above the key resistance (R1: 56,268.85) and near the upper Bollinger Band (56,802.96), signaling strong momentum.
|
Period |
Moving Average Crossover |
Indication |
|
Short Term |
5 & 20 DMA Crossover |
Bullish |
|
Medium Term |
20 & 50 DMA Crossover |
Bullish |
|
Long Term |
50 & 200 DMA Crossover |
Bullish |
All major moving average crossovers confirm a bullish trend, and indicators like RSI (59.21), MACD, and Stochastic are aligned in favour of further upside. Price has broken out of a consolidation zone and is testing the 0.5 Fibonacci level (56,910.80).
|
Indicator |
Level |
Indication |
|
RSI (14) |
59.21 |
Bullish |
|
MACD (12, 26, 9) |
320.59 |
Bullish |
|
Stochastic (20, 3) |
69.91 |
Bullish |
|
ROC (20) |
2 |
Bullish |
|
CCI (20) |
106.22 |
Bullish |
|
Williams %R (14) |
–30.92 |
Bullish |
|
ATR (14) |
624.62 |
Low Volatility |
|
ADX (14) |
18.17 |
Weak Trend |
|
Bollinger Band (20, 2) |
UB: 56,802.96 LB: 55,158.03 SMA 20: 55,980.50 |
– |
If it sustains above 56,478 (R2), it could rally toward 56,723+. On the downside, support lies at 56,024 and 55,814. The trend is bullish with breakout strength, though ADX (18.17) shows it's still gaining traction.
Conclusion
In conclusion, both Nifty 50 and Bank Nifty remain firmly bullish, driven by conclusive moving-average crossovers and strong momentum indicators. Nifty’s next upside hinges on a decisive break above 25,183 for a push to 25,309+, with support at 24,845. Bank Nifty’s immediate hurdle is 56,478—once cleared, it can extend toward 56,723+, while 56,024–55,814 underpins downside risk.
RA Disclaimer: The information provided here is for educational and informational purposes only and should not be construed as investment advice. You are solely responsible for conducting your own research and due diligence before making any financial decisions.