


.jpg)
.jpg)

Indian markets exhibited a mild pullback today after showing strength in the prior session. Both Nifty 50 and Bank Nifty faced resistance at key Fibonacci retracement levels and showed signs of consolidation. Despite the minor dip, the broader trend remains intact, supported by moving averages and pivot structures.
Nifty 50 – Technical Outlook
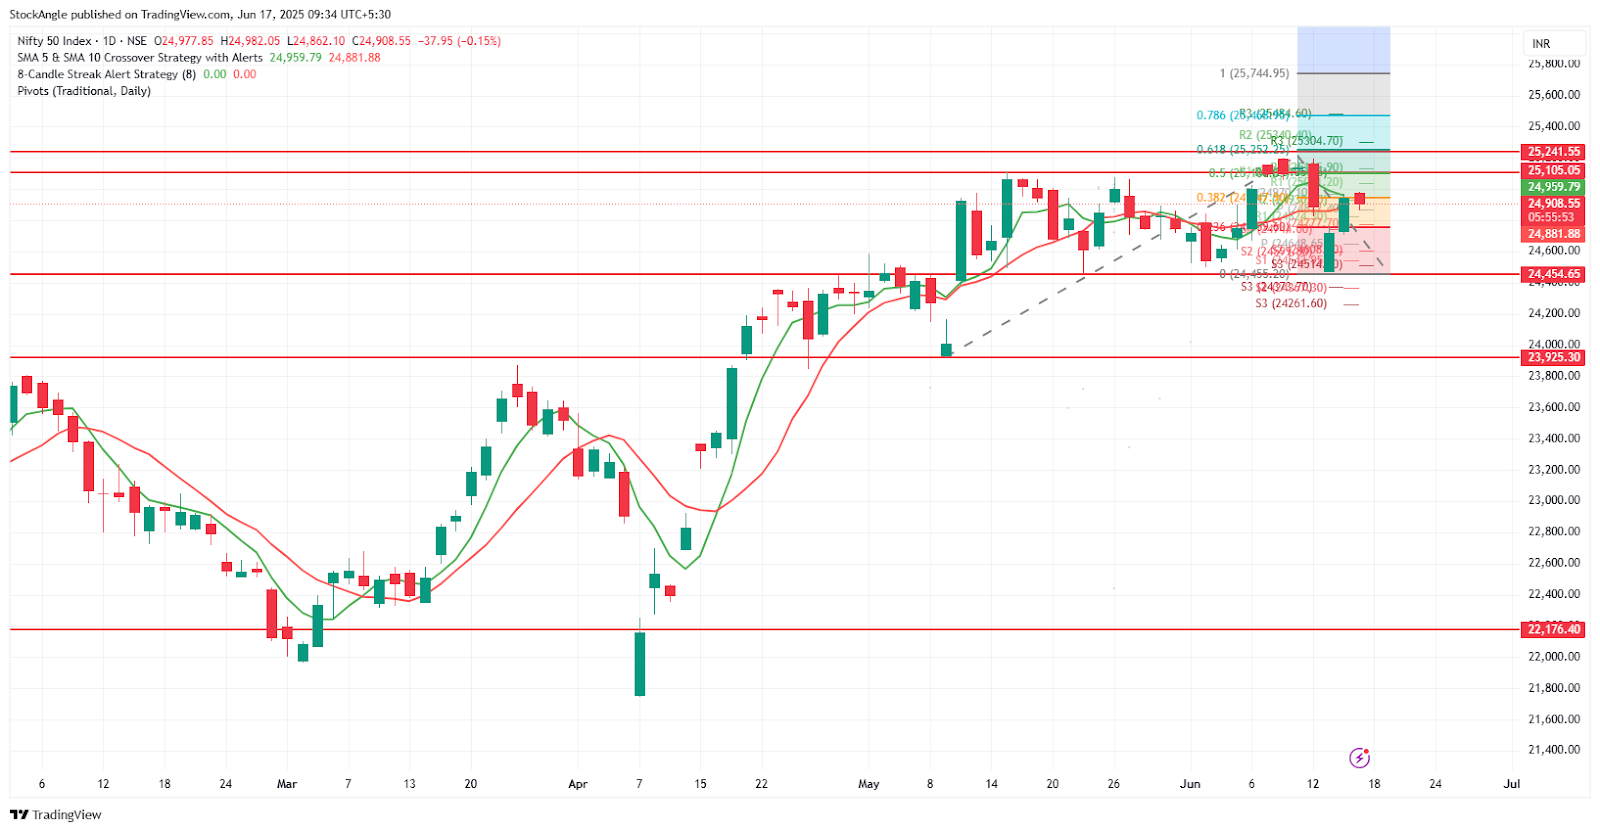
The Nifty 50 index closed at 24,946.50, up by 0.92%. The price bounced off the 0.23.6 Fibonacci retracement level (24,519), suggesting the index is respecting the Fibonacci structure. The broader trend remains bullish as the price continues to trade above its 50, 100, and 200 simple moving averages (SMAs), all of which are rising.
Immediate resistance is at 25,105.05 and then 25,241.55 (prior swing high). A break above 25,241.55 could open targets at 25,525.25 (0.618 Fib) and 25,744.95 (Fibonacci extension).
The Relative Strength Index (RSI) closed at 55.70, indicating mild bullish momentum without approaching overbought conditions.
What Are The Key Technical Levels Of Nifty 50?
|
Type |
Level (₹) |
Description |
|
Current Price |
24,946.20 |
Daily close(16 Jun) |
|
Immediate Support |
24,851.85 |
0.382 Fibonacci |
|
Major Support |
24,454.65 |
Weekly Pivot |
|
Strong Base |
23,925.30 |
Long-term support |
|
Immediate Resistance |
25,105.05 |
Near-term swing |
|
Breakout Level |
25,241.55 |
Fibonacci & price confluence |
|
Extended Target |
25,744.95 |
Full Fibonacci retracement |
|
RSI (14): |
54.90 |
Stable, slightly bullish momentum |
Bank Nifty Technical Outlook For June 17 2025
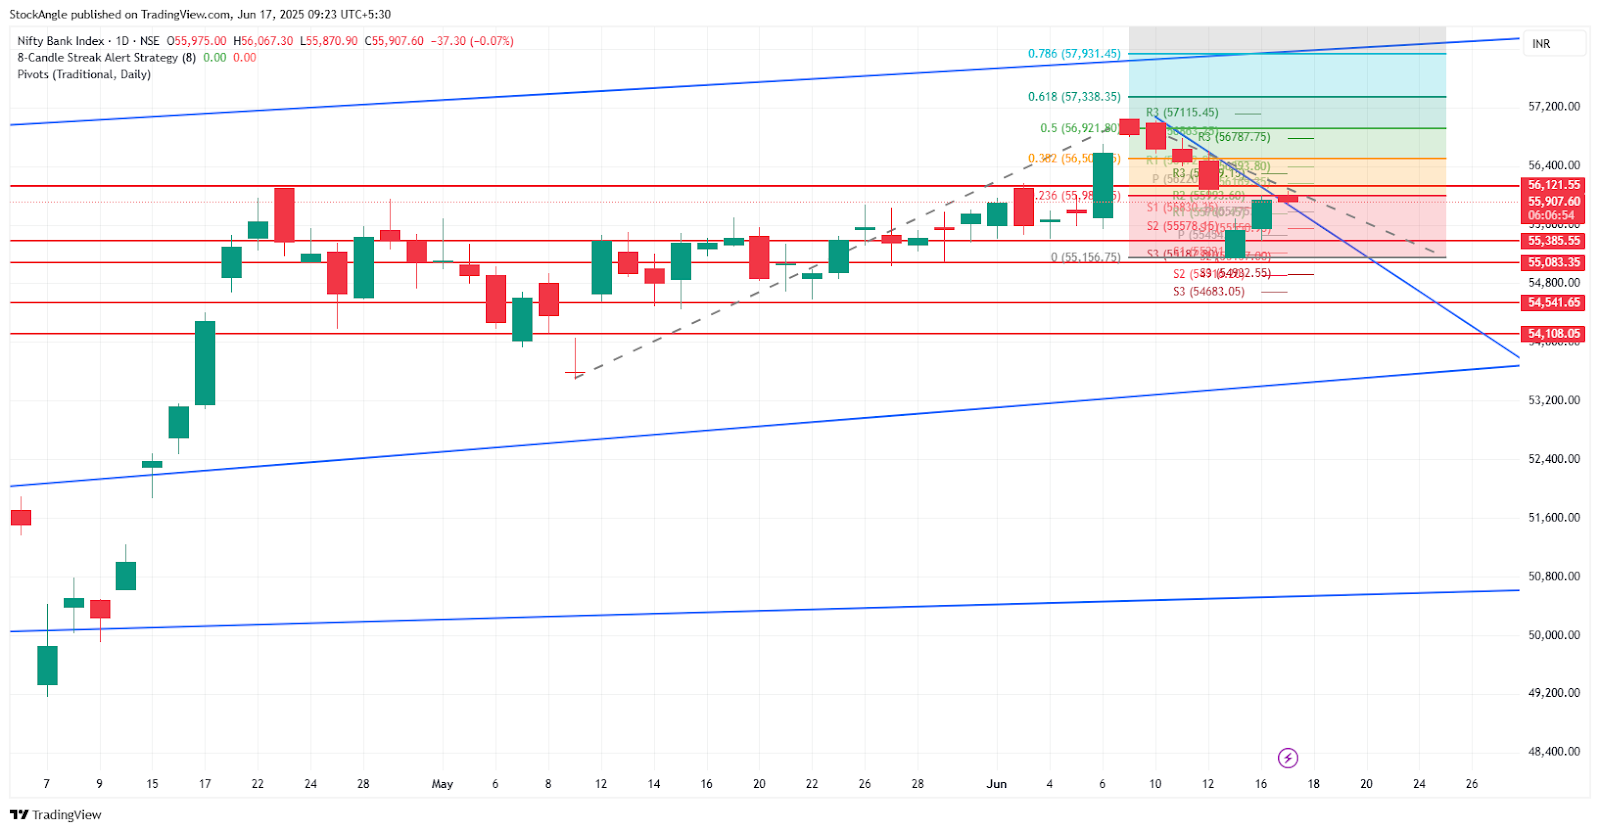
The Bank Nifty index closed at 55,944.90, up by 0.75%, and reclaimed its supertrend support level at 54,991.51. The index has been range-bound between 55,000 and 56,000, with the current close suggesting a potential upside breakout.
Key resistance lies near the 0.382 Fibonacci retracement level at 56,180.65, which must be cleared for the index to push toward 56,999 and 57,819. On the downside, strong support lies at 55,150 and 54,471. A breakdown below these levels could open the door to a retest of 54,569.
The RSI closed at 55.33, which supports the bullish bias while avoiding overbought signals.
Bank Nifty – Key Technical Levels
|
Level Type |
Price (₹) |
Description |
|
Current Price |
55,944.90 |
Daily close |
|
0.236 Fibonacci |
55,147.65 |
Immediate support |
|
0.382 Fibonacci |
56,180.65 |
Immediate Key resistance |
|
0.5 Fibonacci |
56,999.90 |
Next Medium-term resistance |
|
0.618 Fibonacci |
57,819.15 |
Upper resistance |
|
0.786 Fibonacci |
58,985.55 |
Long-term bullish target |
|
Supertrend Support |
54,991.51 |
Key trend confirmation support |
|
Weekly Pivot |
54,299.95 |
Central weekly support |
|
Weekly S1 |
54,041.60 |
Lower support |
|
Weekly R1 |
56,667.60 |
Near-term resistance |
|
Weekly R2 |
57042.45 |
Upper resistance barrier |
|
RSI (14) |
55.33 |
Balanced and positive momentum |
Conclusion
Both Nifty 50 and Bank Nifty show constructive setups. Nifty remains in a solid uptrend, with support from multiple moving averages and rising Fibonacci levels. Bank Nifty, while still in a short-term range, is gaining momentum and could confirm a breakout if resistance levels are breached. Traders should monitor these key technical areas for confirmation of trend continuation or reversal.
RA Disclaimer: The information provided here is for educational and informational purposes only and should not be construed as investment advice. You are solely responsible for conducting your own research and due diligence before making any financial decisions.