

Ujjawal Bhavishya Stock SIP
Secure your future with smart, steady stock investments that grow over time.
Build Long-Term Wealth with Consistent Monthly Investments in Strong Stocks -

|
Industry | Paints |
| CMP | ₹ 2,257 | |
| Market Cap | ₹2,16,486 Cr. | |
| Stock P/E | 49.6 | |
| Dividend Yield | 1.48% |
|
Industry | Banking |
| CMP | ₹ 1,232 | |
| Market Cap | ₹ 8,69,947 Cr. | |
| Stock P/E | 17.7 | |
| Dividend Yield | 0.81% |

|
Industry | Steel |
| CMP | ₹ 982 | |
| Market Cap | ₹ 2,39,948 C | |
| Stock P/E | 49.12 | |
| Dividend Yield | 0.74% |
|
Industry | Banking |
| CMP | ₹ 1,951 | |
| Market Cap | ₹ 3,87,916 Cr | |
| Stock P/E | 19.7 | |
| Dividend Yield | 0.10 |
What is Ujjawal Bhavishya Stock SIP
Ujjawal Bhavishya Stock SIP is a long-term investment strategy that allows investors to invest a fixed amount periodically in a diversified stock portfolio. It helps in wealth creation by leveraging compounding and cost averaging, making it ideal for those seeking disciplined exposure to the stock market while minimizing risks and market volatility.
Why Ujjawal Bhavishya Stock SIP is a Smart Investment Strategy?
- Disciplined Investing
- Cost Averaging
- Compounding Power
- Diversification
- Mitigates Volatility
- Accessible for All Budget
A brief write-up on Ujjawal Bhavishya Stock SIP
ASIANPAINT
Market Cap – Rs 2.16 Lakh Crore
ABOUT - Asian Paints is the largest home decor company in India. The 80+yr old company has major brands like Asian Paints, Apco, etc under its umbrella. The co. is into wall paints, wall coverings, waterproofing, texture painting, wall stickers, mechanized tools, adhesives, modular kitchens, sanitaryware, lightings, soft furnishings, and uPVC windows.
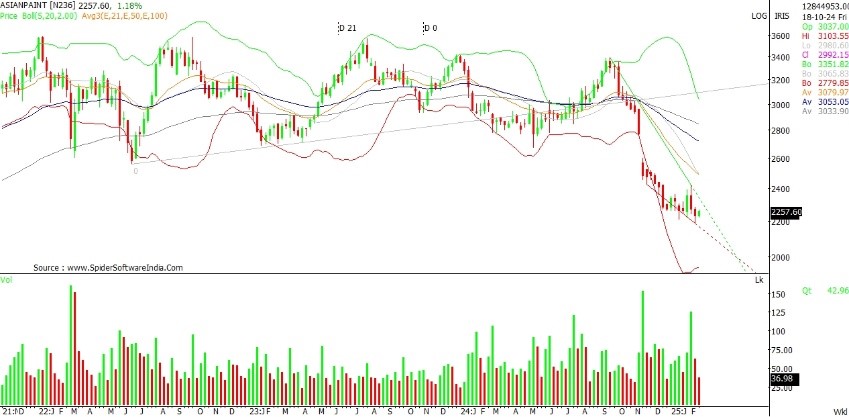
Technical view
- Asian Paints has been on a steady downtrend for the past few months.
- The stock is in a support zone, and a reversal could present a good opportunity.
- The stock is taking support at the lower Bollinger Band, indicating a potential bounce if the price holds above this level.
- An RSI of 35.62 on the monthly chart indicates that the stock is in oversold territory.
ICICI Bank
Market Cap – Rs 8.69 Lakh Crore
ICICI Bank, the second-largest private sector bank in India, offers a wide range of financial products and services to retail, SME, and corporate customers. With an extensive network of branches, ATMs, and other touchpoints, the bank is supported by the ICICI group's presence in life and general insurance, housing finance, and primary dealership
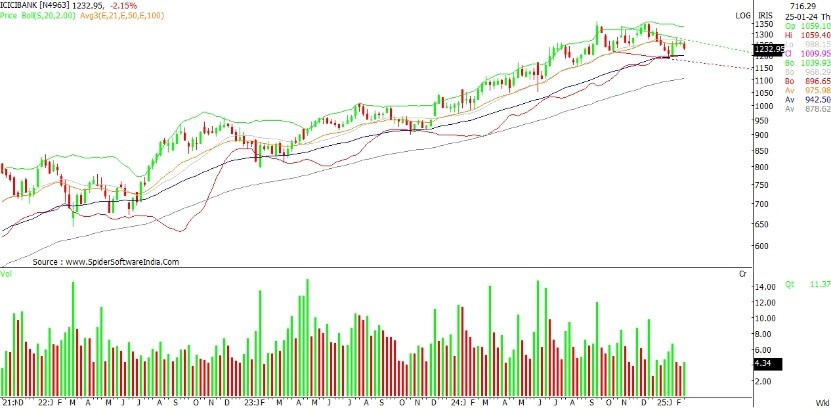
Technical view
- The stock's recent price action suggests base formation, indicating potential stability and future growth.
- The recent price action shows strong momentum from lower levels, suggesting potential for continued upward movement.
- Technical indicators are showing bullish signals across all time frames, indicating a positive outlook for the stock in both the near and long term.
- The overall sector is in a base formation phase, indicating that positive momentum may build in the coming days.
JSW STEEL
Market Cap – Rs 2.39 Lakh Crore
JSW Steel is primarily engaged in the business of manufacture and sale of Iron and Steel Products. It is the flagship business of the diversified, US$ 23 billion JSW Group. The Group has interests in energy, infrastructure, cement, paints, sports, and venture capital
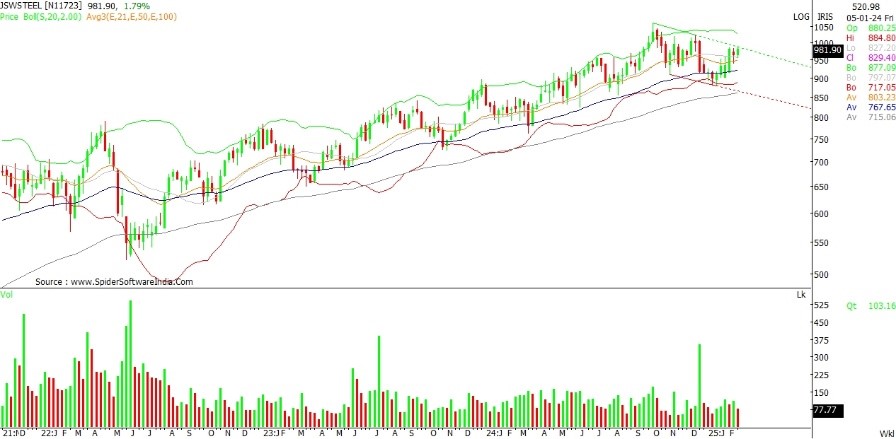
Technical view
- The stock is trading above the major EMAs (20, 50, and 100-day).
- The price is trading significantly above the middle Bollinger Band (20, 2) which indicates a bullish sentiment in the stock.
- The RSI is at 61.47, suggesting strong bullish momentum and showing positive price movement on the monthly chart.
- The stock appears strong on both the monthly and weekly charts. This suggests a bullish price expansion may be underway.
KOTAKBANK
Market Cap – Rs 3.87 Lakh Crore
Kotak Mahindra Bank is a diversified financial services group providing a wide range of banking and financial services including Retail Banking, Treasury and Corporate Banking, Investment Banking, Stock Broking, Vehicle Finance, Advisory services, Asset Management, Life Insurance and General Insurance.
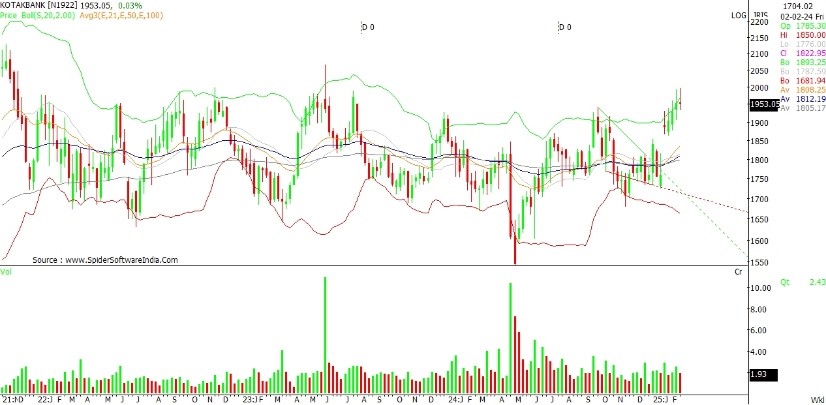
Technical view
- KOTAKBANK is trading above the major EMAs (20, 50, 100, and 200-day), with stock taking support at the 50-day EMA and reversing from there.
- The Bollinger Band (20, 2) also show bullish price expansion, this indicates continued upward momentum in stock.
- Volumes have increased over the past few months. This suggests growing interest and activity in stocks.
- The MACD shows upward divergence on the monthly chart.
- The RSI is at 57.7, indicating bullish price expansion. This suggests continued upward movement in the monthly basket.