

Back


Sectoral Leaders SIP
Be a part of the winning team
Choose Sectoral Leaders SIP for growth.
Long-term wealth starts here Invest in our recommended Stock SIP today!
|
|
Stocks | ACC |
| Industry | Cement | |
| CMP | 1870 | |
| Market Cap | ₹34,959Cr. | |
| Stock P/E | 14.6 | |
| Dividend Yield | 0.41% |
|
|
Stocks | SBIN |
| Industry | Banking | |
| CMP | 730.15 | |
| Market Cap | ₹6,51,274Cr. | |
| Stock P/E | 8.31 | |
| Dividend Yield | 1.89% |
|
|
Stocks | Tata Motors |
| Industry | Auto | |
| CMP | 637.7 | |
| Market Cap | ₹2,35,725Cr. | |
| Stock P/E | 7.34 | |
| Dividend Yield | 0.48% |
|
|
Stocks | NTPC |
| Industry | Power | |
| CMP | 327 | |
| Market Cap | ₹3,16,499Cr. | |
| Stock P/E | 14.3 | |
| Dividend Yield | 2.38% |
What is Sectoral Leaders SIP?
Sectoral Leaders SIP is an investment strategy where you invest in the top stocks from the most successful industries in the market through a SIP (Systematic Investment Plan). Instead of picking random stocks, this approach focuses on companies that are leaders in their sectors—like Cement, Banking and Power etc
These companies are known for their strong growth, stability, and leadership in their fields, making them great choices for long-term wealth creation.
Benefit from the market leaders—Sectoral Leaders SIP
- Focused Exposure to High-Performing Sectors
- Long-Term Growth Potential
- Compound Growth Through SIP
- Diversification
Selection Criteria for Long-Term Investment
- Market Capitalization Stocks with a market cap > ₹30,000 crore.
- Price-to-Earnings (PE) Ratio Stocks with a PE ratio < 20.
- Sectoral Leadership All selected stocks are leaders in their respective sectors.
- Recent Fundamental Correction Stocks that have recently undergone fundamental corrections, offering potential for growth
Stock Overview and Analysis
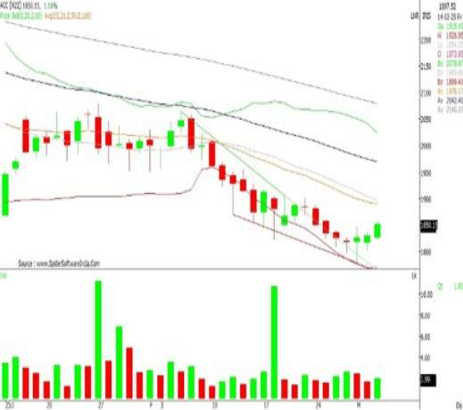
ACC
CMP ₹1870
Technical view
- ACC is trading at the LBB (20,2) and showing a reversal from the LBB on the weekly chart.
- RSI is currently at 33.7, suggesting a potential reversal.
- The stock is at major monthly support area and is have already witnessed deep correction amid weak market cues
- The price is exhibiting some strength from last few weeks indicating downside is restricted from the current zone
Fundamental view
- Strong Market Cap (₹ 34,959 Cr.) – Indicates the company is well established and financially stable.
- Reasonable P/E Ratio (14.6) Stock is fairly valued, making it attractive for investors
- Healthy ROE (14.2%) – Shows good profitability and efficient use of shareholders' equity
- High EPS (₹ 138)- Reflects strong earnings per share, indicating solid profitability
| Metric | Value |
|---|---|
| Market Cap | ₹34,959 Cr. |
| Stock P/E | 14.6 |
| ROE in % | 14.2 |
| EPS | ₹138 |
| D/E | 0.03 |
| Promoter Holding | 56.70% |
| Dividend Yield | 0.41% |
| PEG Ratio | 2.01 |
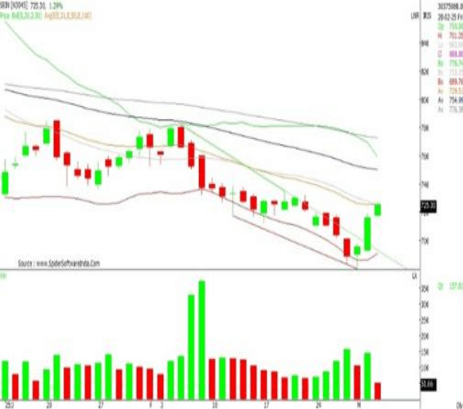
SBI
CMP ₹730.15
Technical view
- The stock is trading above major EMAs (50, 100, 200 period).
- The price has been continuously falling for the last few months and is now showing a reversal from the lower side.
- The RSI is currently at 41.9, suggesting that the stock is reversing.
- On the weekly chart, the stock has reversed from the lower Bollinger Band (20,2), indicating upward momentum.
Fundamental view
- Large Market Cap (₹ 6,51,274 Cr.) Indicates strong market presence and financial stability
- Low P/E Ratio (8.31) – Suggests the stock may be undervalued, making it an attractive investment
- Strong ROE (17.3%) – Shows high profitability and efficient use of shareholder funds
- Good EPS (₹ 88.9) – Reflects strong earnings per share, indicating good profitability
| Metric | Value |
|---|---|
| Market Cap | ₹6,51,274 Cr. |
| Stock P/E | 8.31 |
| ROE in % | 17.3 |
| EPS | ₹88.9 |
| D/E | 0 |
| Promoter Holding | 57.40% |
| Dividend Yield | 1.89% |
| PEG Ratio | 0.08 |
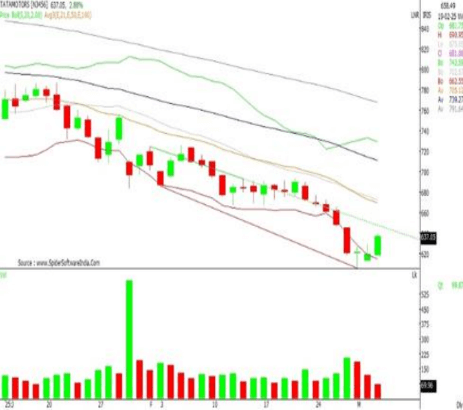
Tata Motors
CMP ₹637.70
Technical view
- The price has shown a decisive downtrend in the past few months and is now at a strong support level.
- The stock looks promising from a medium to long-term perspective and may experience a reversal from the current levels.
- On the technical front, the RSI is currently at 43.4, indicating upward momentum on the weekly chart.
- On the monthly chart, the price is taking support at the 21-period EMA
Fundamental view
- Strong Market Cap (₹ 2,35,725 Cr.) – Indicates the company is well established and financially strong.
- Low P/E Ratio (7.34) – Suggests the stock is undervalued, making it a potential buying opportunity.
- Exceptional ROE (49.4%) – Shows the company is highly efficient in generating profits from equity.
- High EPS (₹ 93.0) – Reflects strong earnings per share, indicating solid profitability.
| Metric | Value |
|---|---|
| Market Cap | ₹2,35,725 Cr |
| Stock P/E | 7.34 |
| ROE in % | 49.4 |
| EPS | ₹93.0 |
| D/E | 1.05 |
| Promoter Holding | 42.60% |
| Dividend Yield | 0.48% |
| PEG Ratio | 0.08 |
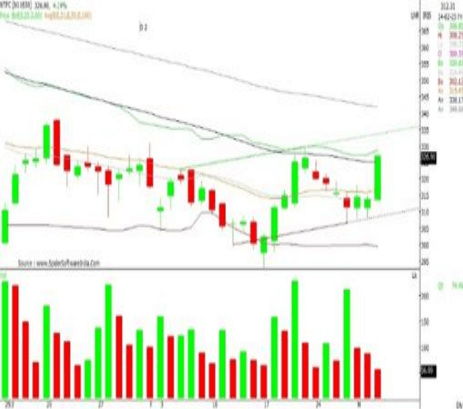
NTPC
CMP ₹327
Technical view
- The price has been consolidating for the last few months and is taking support at the 100-period EMA on the weekly chart.
- RSI is currently at 43.4, indicating upward momentum on the weekly chart.
- On the monthly chart, the price is taking support at the 21-period EMA.
- The stock has given sloping trend line breakout on the daily charts with good weekly volumes
Fundamental view
- Large Market Cap (₹ 3,16,499 Cr.) Indicates strong financial stability and a well-established company.
- Reasonable P/E Ratio (14.3) Suggests a fair valuation compared to earnings, making it attractive for investors
- Decent ROE (13.6%) – Shows the company is generating good returns on shareholders' equity.
- Steady EPS (₹ 22.70) – Reflects consistent earnings per share, indicating stable profitability.
| Metric | Value |
|---|---|
| Market Cap | ₹3,16,499 Cr |
| Stock P/E | 14.3 |
| ROE in % | 13.6 |
| EPS | ₹22.7 |
| D/E | 1.44 |
| Promoter Holding | 51.10% |
| Dividend Yield | 2.38% |
| PEG Ratio | 2.16 |