


.jpg)
.jpg)
In this exciting world of trading, understanding patterns on charts can be like reading signs that guide us in predicting where prices might go next. One special pattern we’ll explore is called the “Pennant Pattern.”
Imagine it as a tiny triangle on the chart after a big price jump. This pattern can tell us if the price will keep going up (a bullish pennant) or down (a bearish pennant).
Let’s uncover the secrets of this pattern and learn how it helps traders make smarter decisions.
What is a Pennant Pattern?
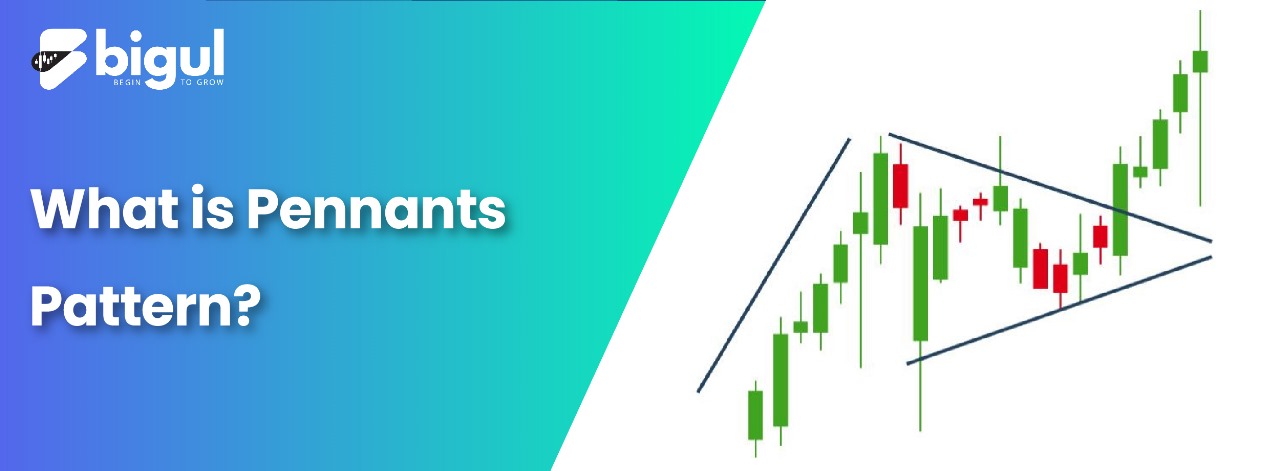
The Pennant Pattern, also known as a “pennant,” is a vital term in trading. Picture a small symmetrical triangle on a price chart after a strong upward or downward move.
This pattern signals a short period of rest or consolidation before another potential price surge. It’s like a flag signaling a brief pause before a new adventure. Traders watch for pennants to predict whether the price trend will continue.
A bullish pennant suggests more price growth, while a bearish pennant hints at further decline. This pattern’s shape and timing hold valuable insights for traders aiming to make informed decisions.
The Pennant Pattern consists of two crucial parts: the flagpole and the pennant.
- Flagpole: Imagine the flagpole as a rapid and steep price movement. This sudden shift in price, whether upwards or downwards, catches the attention of traders. It’s like a quick burst of excitement that creates the foundation for the pattern. This strong movement reflects intense market sentiment and sets the stage for what’s to come.
- Pennant: Now, think of the pennant as a calm period after the excitement of the flagpole. This is when the price movement becomes more restrained and forms a small symmetrical triangle. It’s like a breather for the market, a moment of consolidation where the price range tightens. This phase is essential because it signifies that traders are taking a pause, deciding on their next moves. The pennant’s shape indicates a balance between buyers and sellers, showing uncertainty before the next move.
Together, the flagpole and pennant create a unique visual pattern that offers valuable insights into potential price direction.
Types of Pennant Patterns
Pennant patterns come in two main flavors: bullish and bearish. Each type gives traders a heads-up about where prices might head next.
1. Bullish Pennant
Imagine the market has been on a rising streak, and then suddenly takes a breather with a tight consolidation phase. This pause forms a triangular shape, resembling a pennant on a flagpole. This is a bullish pennant.
It signals that despite the pause, the upward momentum is likely to continue. Traders see this as a temporary rest stop before prices potentially surge even higher.
The pattern suggests that buyers are still in control, even during the consolidation, making it a positive sign for those looking to ride the uptrend.
2. Bearish Pennant
Now, imagine the opposite scenario. The market has been experiencing a downward slide, and then it pauses, forming a similar triangular shape. This is a bearish pennant. Here, the consolidation indicates a temporary halt in the downward momentum.
However, unlike the bullish pennant, this pattern suggests that sellers might regain control and push prices even lower once the consolidation phase ends. It’s like a pause in a downward journey, hinting at the potential for further declines.
In both cases, the pennant shape gives traders valuable clues about the future direction of prices. Whether the momentum will continue or reverse, understanding these patterns can help traders make informed decisions.
Trading Strategies with Pennant Patterns
Once you’ve identified a pennant pattern on a price chart, you’re ready to put this valuable insight to work. Trading with pennant patterns involves strategic planning to make the most of potential price movements.
Here are some effective strategies to consider:
1. Pennant Breakout Strategy
This strategy involves waiting for the price to break out of the pennant formation. Traders anticipate a continuation of the previous trend. When the price breaks above the upper trendline (bullish pennant) or below the lower trendline (bearish pennant), traders may enter a trade in the direction of the breakout. Stop-loss orders are typically placed just outside the opposite side of the pennant.
2. Measuring the Flagpole
The flagpole is the initial strong price movement that precedes the formation of the pennant. Traders can measure the length of the flagpole and use that measurement to estimate the potential price move after the breakout. This can help set price targets for the trade.
3. Volume Confirmation
Analyzing trading volume can provide confirmation for a pennant breakout. An increase in volume as the price approaches the apex of the pennant often indicates growing interest and potential for a strong breakout. Traders look for above-average volume when the breakout occurs, as it suggests a more significant move is likely.
4. Multiple Timeframe Analysis
Traders often use multiple timeframes to analyze pennant patterns. A pennant on a shorter time frame might be a continuation pattern, while on a larger time frame, it could signal a reversal. Combining signals from different timeframes can provide a more comprehensive view of the pattern’s potential outcome.
5. Confirmation Indicators
Traders might use technical indicators, such as the Relative Strength Index (RSI) or Moving Average Convergence Divergence (MACD), to confirm the strength of a potential breakout. If these indicators show bullish or bearish divergence, it can add weight to the potential success of the pattern.
6. Watch for False Breakouts
Pennant patterns can sometimes lead to false breakouts, where the price briefly moves in one direction before reversing. To mitigate this risk, traders might wait for a candlestick close beyond the trendline before considering it a valid breakout.
Remember that no trading strategy is foolproof, and trading always carries inherent risks. It’s important to practice good risk management, stay informed about market news, and consider using a combination of technical and fundamental analysis when making trading decisions.
Conclusion
The pennant pattern stands as a significant tool in technical analysis, offering traders valuable insights into potential price movements. Its distinct flag-like shape, formed by a brief consolidation phase following a strong price move, signals an impending continuation of the trend.
Traders who adeptly recognize and interpret this pattern can make informed decisions, enhancing their trading strategies and maximizing profit potential. The pennant pattern exemplifies the power of chart patterns in deciphering market dynamics and guiding trading actions.