



What Actually Makes a Stock Cheap?
 06-Oct-2026
 2 mins read
Trending Now
-

Turtlemint Fintech Solutions IPO GMP, Open Date, Price Band, Issue Size 18-Jun-2026
-
.jpg)
SpaceX IPO: Elon Musk Becomes World's First Trillionaire — Key Facts Explained 13-Jun-2026
-

Zepto IPO, Open Date, Issue Size, Price Band and UDRHP Filed 12-Jun-2026
-

Shah Metacorp Rights Issue May 2026 Details, Record Date, Issue Price 26-May-2026
-

Jio Is Going Public. Here's What That Actually Means for You 11-May-2026
-

Parle Products IPO: India’s Most Iconic Biscuit Brand Going Public? 30-Apr-2026
-
Gujarat Cotex Rights Issue 2026 Details, Record Date, Issue Price 27-Mar-2026
-
.jpg)
Avi Polymers Rights Issue 2026 Details, Record Date, Issue Price 11-Feb-2026
-

D & H India Rights Issue 2026 Details, Record Date, Issue Price 05-Feb-2026
-

Avasara Finance Rights Issue 2025 Details, Record Date, Issue Price 29-Dec-2025

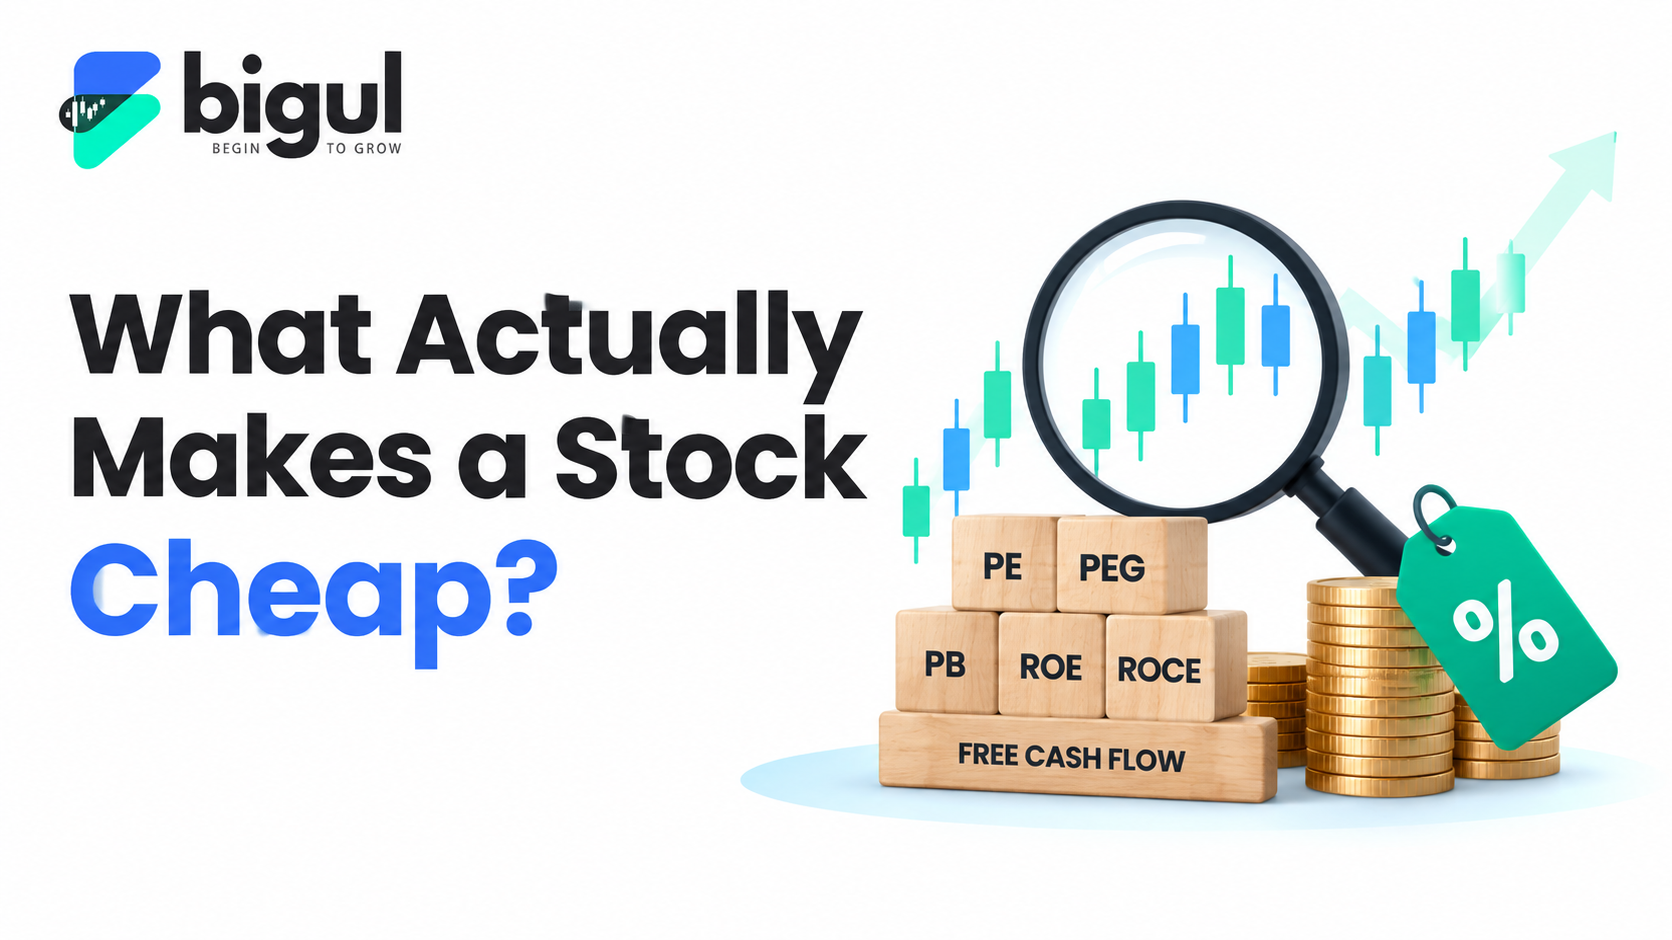
What Actually Makes a Stock Cheap? Understanding Valuation Metrics and Value Traps
Markets are falling, your portfolio is down, and everything on your watchlist looks cheaper than it
did six months ago.
And somewhere in your head, a voice is saying: this might be the time to buy.
Maybe it is. Maybe it is not.
A stock falling 30% doesn’t make it cheap. It makes it 30% cheaper than it was.
Those are two completely different things.
A stock is cheap when its price is below what the business is actually worth. Not below what it was trading at last January. Below what a rational buyer would pay for the underlying business, its earnings, its assets, its future cash flows.
Where Does the Market Actually Stand?
The Nifty 50 PE ratio as of October 5 2026 is 19.30.
The 10-year average Nifty PE is 23.28. The current PE is 17.6% below that average. The lowest the Nifty PE has reached in the last decade was 17.15, at the COVID crash bottom in March 2020.
The Nifty PB ratio is currently 2.75 — 24% below its 10-year average of 3.62.
Here is what makes this interesting.
Nifty 50 earnings grew at 12.34% annually over the last five years. The index itself moved only 5.04% annually over the same period. Corporate India is earning significantly more, but the market is paying less per rupee of those earnings than it was at the peak.
The correction is a valuation correction, not an earnings collapse.
Companies are not suddenly earning less. Investors are paying less for the same earnings, driven by FII outflows, rising US bond yields, crude, and sentiment. That is a very different market from one where earnings are deteriorating.
Historically PE below 20 on the Nifty 50 has been the entry zone long-term investors look back on as the opportunity.
Related Reading : what is happening in Indian Stock Markets
How to Find Genuinely Cheap Individual Stocks
Start With PE — But Do Not Stop There
A PE of 15 means you are paying ₹15 for every ₹1 the company earns annually.
But PE alone is dangerous without context.
A PSU bank at PE 8 might look cheap until you realise the sector average is also 10 and earnings quality is questionable. A technology company at PE 28 might look expensive until you realise the sector trades at 35 and this company is growing faster than peers.
The right comparison is always against the sector average, not the broad market, and never look at PE without checking what is underneath the earnings number.
PE Adjusted for Growth — The PEG Ratio
The PEG ratio divides PE by the expected earnings growth rate.
A company at PE 15 growing earnings at 20% annually has a PEG of 0.75. A company at PE 10 growing at 5% has a PEG of 2. The first, despite the higher P/E, is genuinely cheaper. Because you are buying its future, not just its present.
A PEG below 1 signals that earnings growth can outpace the current valuation. This is particularly powerful in India's mid-cap space where high-growth businesses often get dismissed as expensive on PE alone.
learn more : PEG Ratio : What is it and how to calculate
Price-to-Book — What You Are Paying for the Business's Assets
PB compares market price to book value: The company's net worth if you stripped out all liabilities and sold everything.
A PB below 1 can be a genuine bargain or a warning that the assets are not worth what the balance sheet claims.
This ratio is most useful for asset-heavy businesses: banks, NBFCs, metals, real estate. But the quality of those loan books and the trajectory of asset quality determines whether those numbers represent value or a trap.
ROE and ROCE — Is the Business Actually Good?
A low PE means nothing if the business is destroying value.
ROE tells you how much profit the company generates for every rupee of shareholder money. ROCE tells you how efficiently the business uses all the capital inside it.
The combination every serious value investor looks for is ROE above 15%, strong ROCE, and a low PB ratio. A business that is genuinely efficient and genuinely undervalued.
Free Cash Flow — The Number That Cannot Lie
Free cash flow, the cash left after the business pays for everything it needs to maintain and grow, is significantly harder to manipulate.
A business consistently generating free cash flow shows its profits are real and that it doesn't need outside money to keep functioning. In a correction where sentiment drives prices down indiscriminately, free cash flow separates businesses worth buying from ones that merely look cheap.
The Value Trap
Stocks can be cheap for very good reasons.
Heavy promoter pledging creates selling pressure if the stock falls further, pushing it below rational valuation and then continuing lower. Poor management consistently destroys capital, no matter how attractive the entry price looks.
The PE can look attractive. But four things can make it irrelevant.
Earnings that are flat while the sector moves on. Management that sits on capital while competitors invest. Promoter pledging that keeps climbing. A competitive position that is quietly losing ground.
Any one of these — and the cheap stock stops being an opportunity.
Related Guide : How to find best Investment opportunities in stock market
FAQs
What is a value trap?
A stock that appears cheap on valuation metrics but keeps falling because the cheapness is justified by deteriorating fundamentals, poor governance, structural decline, or promoter financial stress.ch
What PE is considered cheap for Indian stocks?
Analysts generally look for PE below 15 as a starting signal, but this varies significantly by sector. A PE of 15 is cheap for an IT company but may be fair for a PSU bank.
Is the Indian market cheap right now?
The Nifty 50 PE of 19.30 as of October 5 2026 sits below every historical median. PE below 20 has historically been an attractive long-term entry zone. Whether individual stocks are cheap depends entirely on their specific fundamentals.
Explore more : Six Questions Every Investor Must ask before Investing