



The Market Was Down but these Sectors Were Up. Here Is What Nobody Told You.
 09-Oct-2026
 2 mins read
Trending Now
-

Turtlemint Fintech Solutions IPO GMP, Open Date, Price Band, Issue Size 18-Jun-2026
-
.jpg)
SpaceX IPO: Elon Musk Becomes World's First Trillionaire — Key Facts Explained 13-Jun-2026
-

Zepto IPO, Open Date, Issue Size, Price Band and UDRHP Filed 12-Jun-2026
-

Shah Metacorp Rights Issue May 2026 Details, Record Date, Issue Price 26-May-2026
-

Jio Is Going Public. Here's What That Actually Means for You 11-May-2026
-

Parle Products IPO: India’s Most Iconic Biscuit Brand Going Public? 30-Apr-2026
-
Gujarat Cotex Rights Issue 2026 Details, Record Date, Issue Price 27-Mar-2026
-
.jpg)
Avi Polymers Rights Issue 2026 Details, Record Date, Issue Price 11-Feb-2026
-

D & H India Rights Issue 2026 Details, Record Date, Issue Price 05-Feb-2026
-

Avasara Finance Rights Issue 2025 Details, Record Date, Issue Price 29-Dec-2025

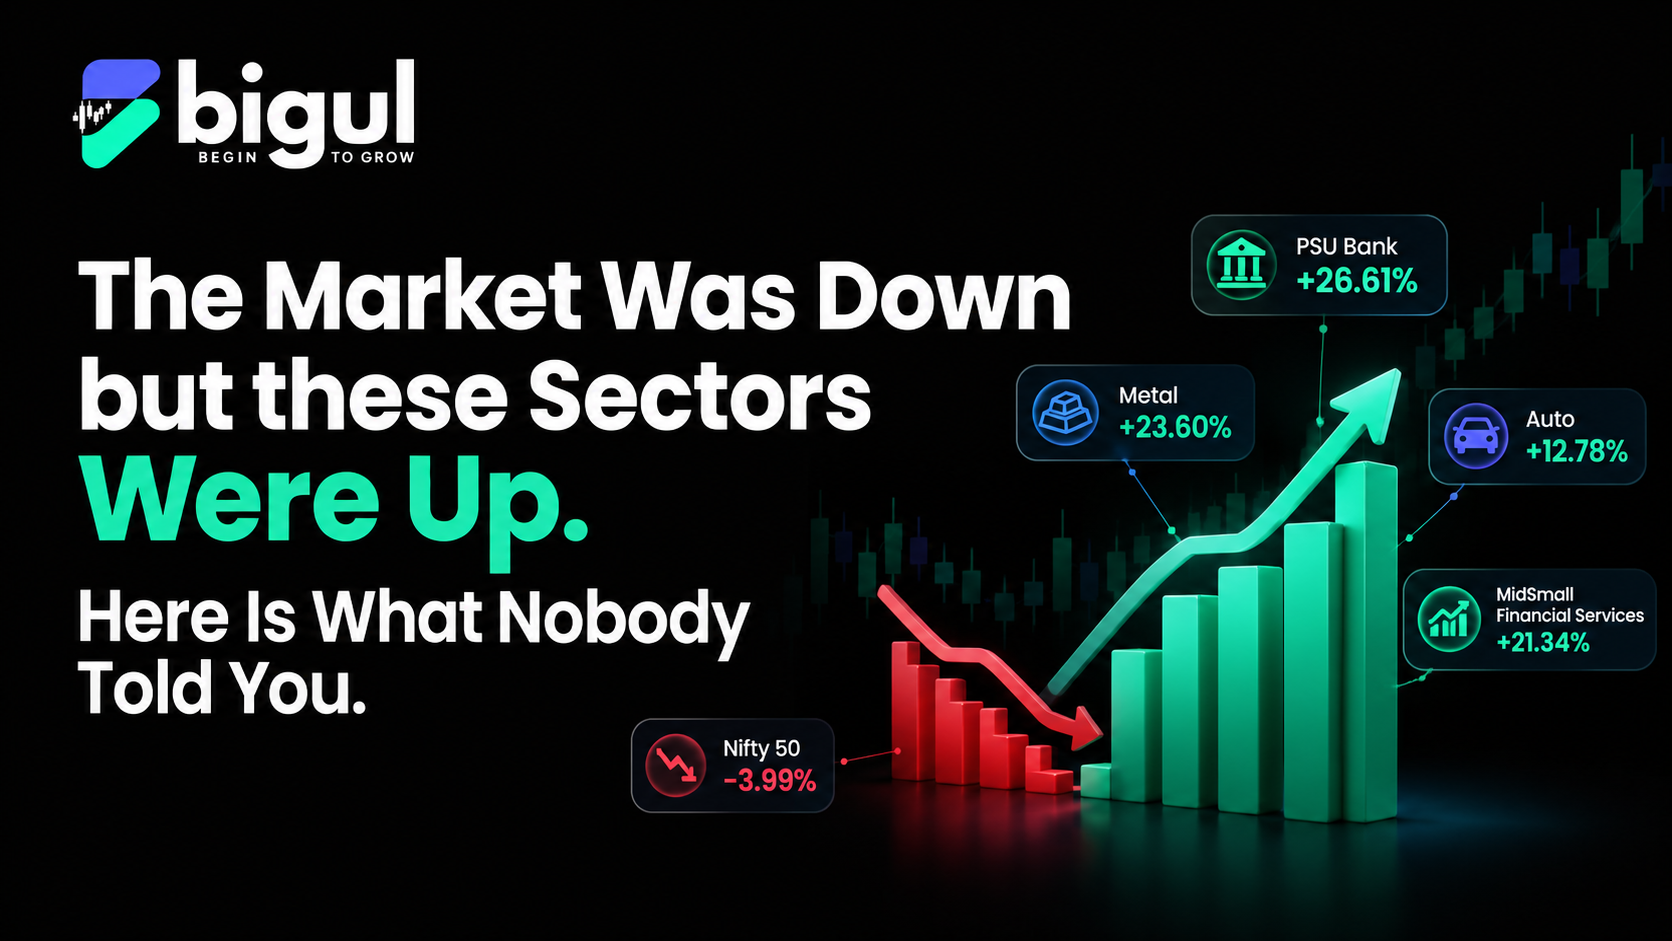
Sector Rotation in FY26: PSU Banks and Metals Outperform as the Nifty 50 Declines
In FY 2025-26, the Nifty 50 fell 3.99%.
If you read only that headline, you would think it was a bad year for Indian equities.
You would be wrong.
In the same financial year, Nifty PSU Bank gained 26.61%. Nifty Metal gained 23.60%. Nifty MidSmall Financial Services gained 21.34%. Nifty Auto gained 12.78%.
The gap between the best-performing sector and the worst, PSU Banks at +26.61% and Realty at -23.26% was 49.87 percentage points.
This is sector rotation, and understanding it is the difference between reading a market headline and actually understanding what the market is doing.
Why the Index Can Lie to You.
The Nifty 50 is not an equal-weighted basket of 50 companies.
It is a free-float market-capitalisation-weighted index. The heaviest stocks carry the most weight.
When those stocks fall, the index falls. Even if thirty other companies are doing perfectly well.
This is why "the market fell" can be one of the most misleading sentences in investing.
The headline said -3.99%. But beneath that number, some of the biggest gains in Indian equities were quietly happening in sectors the Nifty wasn't built to capture.
Related Reading : what makes stock price go up and down
What Actually Happened in FY26
|
Sector |
FY26 Return |
vs Nifty 50 |
|
Nifty PSU Bank |
+26.61% |
+30.60 pts |
|
Nifty Metal |
+23.60% |
+27.59 pts |
|
Nifty MidSmall Financial Services |
+21.34% |
+25.33 pts |
|
Nifty Auto |
+12.78% |
+16.77 pts |
|
Nifty Pharma |
+5.94% |
+9.93 pts |
|
Nifty Oil & Gas |
+3.19% |
+7.18 pts |
|
Nifty 50 |
-3.99% |
— |
|
Nifty Bank |
-1.73% |
+2.26 pts |
|
Nifty FMCG |
-13.78% |
-9.79 pts |
|
Nifty IT |
-19.35% |
-15.36 pts |
|
Nifty Realty |
-23.26% |
-19.27 pts |
Source: NSE Indices, Index Dashboard, 31 March 2026. Returns are absolute TRI returns.
Why Does This Happen?
Sectors don’t move together because they don’t live in the same economic world.
Earnings cycles diverge. A bank’s year depends on whether businesses and households are borrowing — and paying back. An IT company’s year depends on what technology budgets look like in the US. A metal producer’s year depends on what steel and copper are fetching globally.
Policy matters differently for each sector. India’s PLI framework covers 14 sectors, but an incentive for speciality steel changes nothing for a software exporter. And the same rate hike that helped banks earn more on loans made borrowing more expensive for the buyers real estate companies were depending on.
Global vs domestic exposure. Nifty IT fell 19.35% in FY26. The primary reason: US technology spending slowed, deal conversions were delayed, and the global macro environment for technology budgets was uncertain. That had nothing to do with what was happening in Indian bank branches or PSU order books.
Valuation gaps matter. A sector does not need good news to rally. It just needs news that is better than what the market had already assumed. Realty was priced for the worst of the rate cycle. IT was priced for uninterrupted growth. When either assumption proved wrong — the price moved accordingly.
The Most Important Investor Lesson From FY26
Two investors. Both were in Indian equities and described themselves as diversified.
One was overweight IT and Realty. One was overweight PSU Banks and Metals.
In FY26, their experiences were approximately 50 percentage points apart.
Same asset class. Same country. Same financial year.
This is why sector exposure is one of the most underanalysed risks in a direct equity portfolio.
Ten stocks can look diversified and still be concentrated in the same interest rate cycle, commodity price, export market, or the same government policy. The number of holdings is not the measure of diversification. The economic drivers underneath those holdings are.
Compare Investment Route : Stock SIP vs Mutual fund SIP which is Better
What Sector Rotation Is Not
Sector rotation is not a trading strategy or a signal to chase last year's winner.
PSU Banks outperformed in FY26. That does not mean PSU Banks will outperform in FY27. The earnings cycle that drove their outperformance could be maturing. Depressed valuations are now higher. The conditions that supported the move may not repeat.
Rotation describes what happened to capital. It doesn’t tell you where the capital should go next.
Investors who use sector rotation well aren't the ones jumping between last year's winners. They understand which economic conditions each sector is sensitive to and whether those conditions are likely to improve or deteriorate from here.
Complete guide : How to choose First stock for Investment
What to Actually Look For
Before drawing any conclusion from sector performance, four questions worth asking:
What drove the earnings? Volume, pricing, margins, credit costs or a one-off item that will not repeat?
Is the improvement broad or narrow? A sector index can be pulled up by two or three large constituents while the rest of the sector lags. Index return and sector health are not always the same thing.
What is the starting valuation? A sector that has already rerated significantly offers a different risk-reward than one still trading below historical averages.
What reverses the conditions? Every sector tailwind has a headwind scenario. Rate normalisation for banks. Commodity price correction for metals. Demand recovery for IT. Knowing what could change the picture is as important as knowing what drove it.
FAQs
What is sector rotation in simple terms?
Think of it as money moving rooms — not leaving the building. In FY26, capital walked out of IT and Realty and into PSU Banks and Metals. The Nifty ended the year roughly where it started. But inside that number — significant money had changed hands across sectors.
Should I change my portfolio based on sector rotation?
Sector rotation describes what happened, not what will happen. The more useful question is whether your current portfolio is concentrated in sectors where the earnings cycle is maturing or where valuations have stretched.
Why did PSU Banks outperform so much in FY26?
Several factors converged — improving asset quality after years of cleanup, strong government infrastructure lending, a domestic credit cycle that was healthier than expected, and valuations that were still depressed relative to history when the year began.
Visit : Invest in Stock Baskets Today