

Nifty and Bank Nifty Weekly Outlook from July 21 to July 25, 2025
 18-Jul-2025
 2 mins read
Trending Now
-

Turtlemint Fintech Solutions IPO GMP, Open Date, Price Band, Issue Size 18-Jun-2026
-
.jpg)
SpaceX IPO: Elon Musk Becomes World's First Trillionaire — Key Facts Explained 13-Jun-2026
-

Zepto IPO, Open Date, Issue Size, Price Band and UDRHP Filed 12-Jun-2026
-

Shah Metacorp Rights Issue May 2026 Details, Record Date, Issue Price 26-May-2026
-

Jio Is Going Public. Here's What That Actually Means for You 11-May-2026
-

Parle Products IPO: India’s Most Iconic Biscuit Brand Going Public? 30-Apr-2026
-
Gujarat Cotex Rights Issue 2026 Details, Record Date, Issue Price 27-Mar-2026
-
.jpg)
Avi Polymers Rights Issue 2026 Details, Record Date, Issue Price 11-Feb-2026
-

D & H India Rights Issue 2026 Details, Record Date, Issue Price 05-Feb-2026
-

Avasara Finance Rights Issue 2025 Details, Record Date, Issue Price 29-Dec-2025


Nifty and Bank Nifty Weekly Outlook from July 21 to July 25, 2025
Nifty 50 and Bank Nifty shows cautious consolidation after recent breakdowns. Nifty 50 faces key support at 24,900–24,650, with resistance near 25,250; bullish risks hinge on reclaiming 25,250. Bank Nifty remains fragile around 56,000–55,754 support, with resistance at 57,000. Technical indicators signal short‑term bearishness, offset by oversold readings that may trigger relief bounces. Overall market sentiment remains weak.
Nifty 50 weekly Outlook
Nifty 50 News: The index closed at 24,968.40, down 143 points, slipping below the critical 25,000 support zone. Despite medium- and long-term bullish moving average crossovers, the current Nifty 50 trend remains cautious, with a bearish 5–20 DMA crossover signalling further short-term weakness. Key indicators—RSI at 43 and CCI at –115—underscore this downbeat Nifty 50 trend, even as stochastic and %R readings suggest oversold conditions.
From a Nifty 50 weekly trend perspective, the index sits just above its lower Bollinger Band (24,904), hinting at a possible technical rebound if follow‑through buying emerges. Immediate support lies at 24,875 and 24,650, while resistance for Friday and next week is pegged at 25,101 and 25,236. Pivot levels reinforce this Nifty 50 weekly trend analysis: a close below 24,900 could accelerate selling toward 24,650, whereas a rally above 25,250 may relieve bearish pressure.
Ahead in the Nifty 50 News cycle, chances are that next week can give a small technical lift, but overall sentiment is weak. The protracted low below 24,900 would further rule out any upside reaction, effects of this to the weak Nifty 50 trend, and a quick gain on 25,250 would stop the further falls. On the weekly chart, the structural Nifty 50 weekly trend needs a decisive move above that level—otherwise, further downside pressure could dominate the sessions ahead.
Nifty 50 Chart
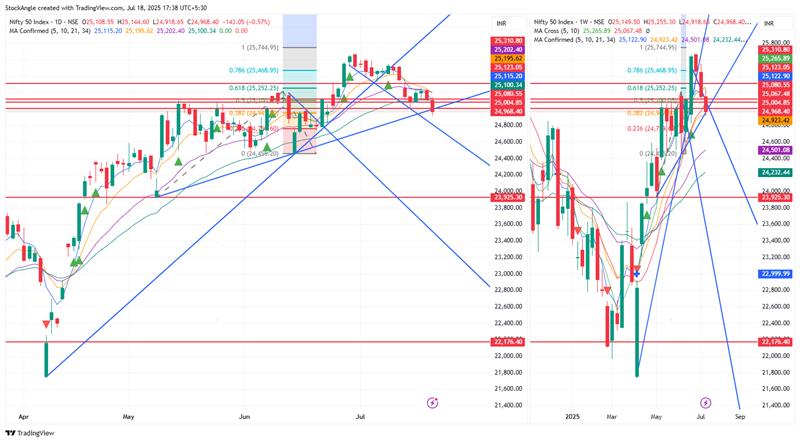
Nifty 50 Chart
As shown in the above chart of Nifty 50, the daily and weekly candles show consolidation amid resistance at 25,000 and support at 24,800. At 0.382 and 0.618, fibonacci retracement meets with trendlines, and the possibility of reversal zones is present. The 21 and the 50 short-term moving averages are also flattening out to show indecision. Observing the NIFTY 50 chart in real-time, traders are advised to look at a key move above 25250 to extend the buying pressure or a close below 24900 in order to validate the downward pressure.
Nifty 50 Technical Levels
|
Indicator |
Value |
Action |
|
RSI(14) |
43.07 |
Bearish |
|
MACD(12,26,9) |
38.93 |
Bullish |
|
Stochastic(20,3) |
17 |
Oversold |
|
ROC(20) |
-0.57 |
Bearish |
|
CCI(20) |
-115.05 |
Bearish |
|
Williamson%R(14) |
-92.78 |
Oversold |
|
ATR(14) |
193.88 |
Low Volatility |
|
ADX(14) |
15.86 |
|
|
UB : 25,731.68 |
||
|
LB : 24,904.45 |
Nifty 50 Weekly forecast
This week's Nifty 50 forecast anticipates a cautious bounce near 24,900, but the Nifty 50 prediction remains weak without sustained buying above 25,250. The weekly Nifty 50 forecast sees a relief rally, but the Nifty 50 prediction hinges on reclaiming 25,250 to reverse the Nifty 50 trend. In our Nifty 50 forecast, slipping below 24,900 intensifies pressure and the Nifty 50 trend will depend on volatility. Final Nifty 50 prediction: downside bias continues, keeping the Nifty 50 trend under pressure.
Bank Nifty Weekly Outlook
Bank Nifty chart closed at 56,283, down 0.96% amid weak market breadth and a technical breakdown from a symmetrical triangle. The daily RSI at 45.3 suggests caution, while the MACD and ROC remain bullish, adding resilience to the Bank Nifty chart. However, short‑term indicators like the Stochastic and CCI hint at bearishness, and the Williamson %R sits deep in oversold territory (–94.51), possibly foreshadowing a bounce from oversold levels on the Bank Nifty chart.
Price has breached the lower Bollinger Band at 56,205, and the 5 & 20 DMA crossover has turned bearish, reinforcing a cautious Bank Nifty Trend for tomorrow. Immediate support lies at 56,000 and 55,754, with a break below likely to test 55,123 next week. Resistance looms at 56,454 and 56,754. The broader Bank Nifty Trend remains supported by bullish MACD and ROC, but momentum has weakened.
On the weekly Bank Nifty chart, the Bank Nifty's weekly trend remains up but fragile, as the price flirts with the 20 EMA and Fibonacci support (38.2% at 56,494). The Bank Nifty weekly trend stays mildly bearish to neutral unless the index decisively reclaims 57,000. Monitoring the Bank Nifty weekly trend will be crucial over the coming sessions. Overall, the Bank Nifty Trend suggests caution until key levels are tested.
Bank Nifty Chart
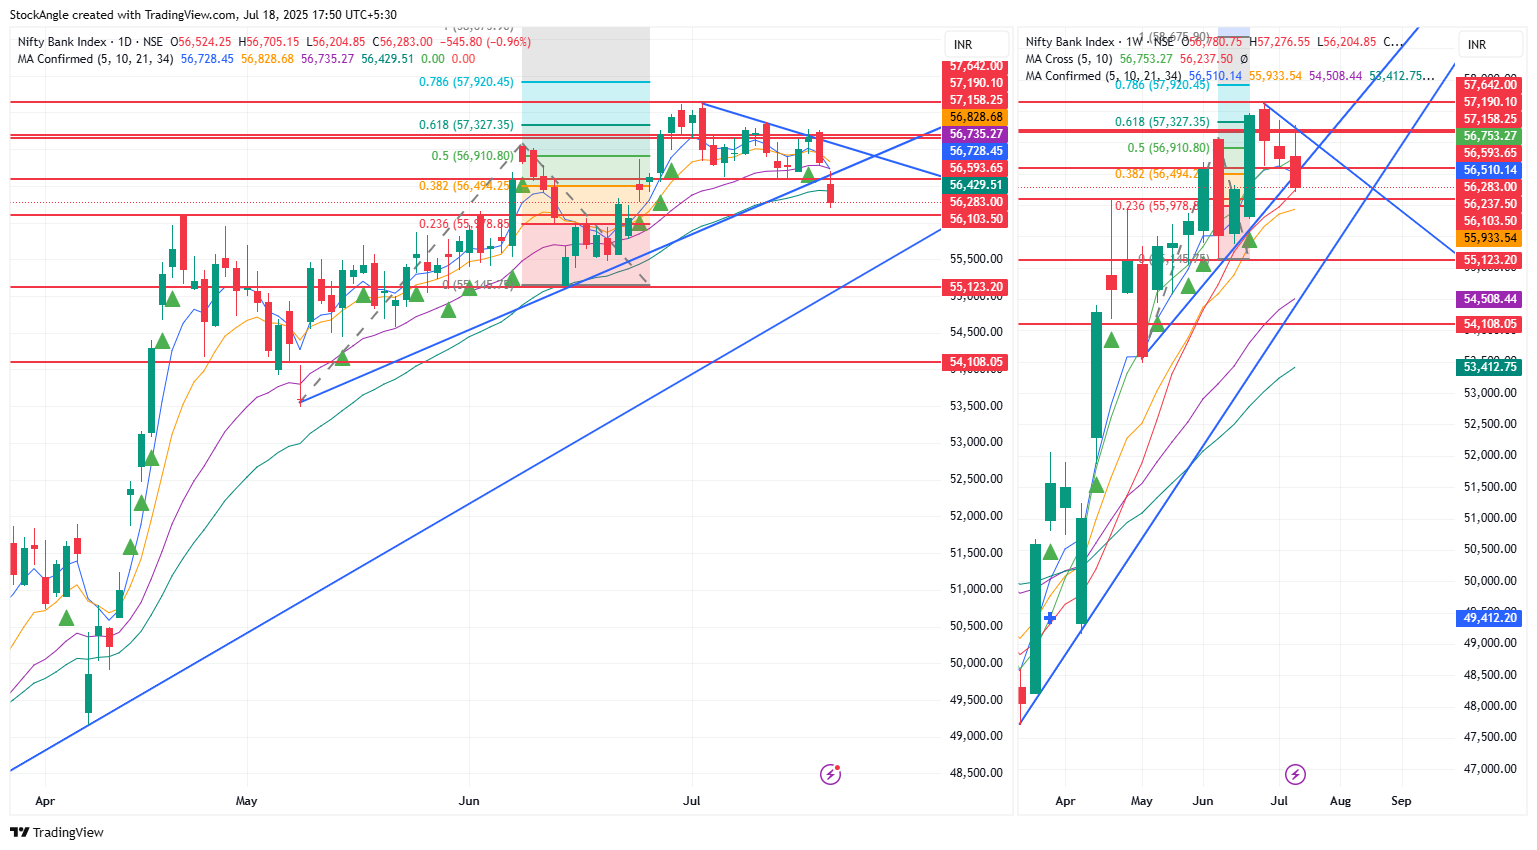
Bank Nifty Chart
Bank Nifty chart demonstrates a sell‑off after breaching a rising trendline, closing at 56,283. The Bank Nifty chart live shows the index slipping below its 5 and 20 DMAs, testing the lower Bollinger Band. The Bank Nifty chart live highlights bearish momentum with the daily RSI near 45 and the stochastic oscillator rolling over. Watching on the Bank Nifty chart live, immediate support at 56,000 and 55,754 will be critical. A sustained rebound above 56,454 could restore bullish bias.
Bank Nifty Technical Levels
|
Indicator |
Level |
Indication |
|
RSI(14) |
45.3 |
Neutral |
|
MACD(12,26,9) |
198.48 |
Bullish |
|
Stochastic(20,3) |
27.24 |
Bearish |
|
ROC(20) |
0.05 |
Bullish |
|
CCI(20) |
-141.4 |
Bearish |
|
Williamson%R(14) |
-94.51 |
Oversold |
|
ATR(14) |
490.76 |
Low Volatility |
|
ADX(14) |
19.32 |
Weak Trend |
|
Bollinger Band(20,2) |
UB : 57,651.28 |
|
|
LB : 56,205.80 |
||
|
SMA20 : 56,928.54 |
Bank Nifty Weekly Forecast
The bank Nifty will most probably trade carefully in the coming week after it moves below the lower band of its Bollinger Bands and went through a symmetrical triangle. RSI and oscillators explain bearish pressure every day, but MACD and ROC encourage its hold.Immediate floors around 56,000 and 55,754 may contain declines, with deeper support near 55,123. A decisive move above 57,000 can restore bullish momentum; otherwise neutral to negative bias will prevail.
RA Disclaimer: The information provided here is for educational and informational purposes only and should not be construed as investment advice. You are solely responsible for conducting your research and due diligence before making financial decisions.