


As the festival of lights illuminates our lives with hope and positivity, it also marks the beginning of a new financial year — Samvat 2082. This auspicious occasion reminds us that every new beginning brings fresh opportunities for growth and prosperity.
The global and domestic economic landscapes continue to evolve, but India stands resilient as one of the world’s fastest-growing economies. With robust corporate earnings, government-led infrastructure push, and strong investor confidence, the outlook for Indian equities remains bright. Despite short-term market fluctuations, the long-term growth story of India continues to inspire optimism.
As we celebrate Diwali, a symbol of light dispelling darkness, let us also ignite the light of financial wisdom. This Samvat 2082, may your investments shine brighter, your wealth grow stronger, and your financial journey be filled with prosperity and success.
Let’s step into Samvat 2082 with renewed optimism — embracing opportunities, staying disciplined, and investing wisely for a brighter financial future

(Long-term investments give stable and fruitful results. To grow your wealth, you must use wisdom and patience.
Your actions should serve a meaningful purpose — not just quick profit. When you invest carefully and ethically, your prosperity lasts for a long time.)
SAMVAT 2082
Celebrate the Festival of Wealth with Our
Top 10 Investment Ideas
Holding Period: 12 months
| Stocks Name | Buy Price | Quantity | Stop Loss | Target |
|---|---|---|---|---|
| ADANIENT | 2590 | 2 | 2378 | 3078 |
| ASIANPAINT | 2335 | 2 | 2156 | 2934 |
| AXISBANK | 1159 | 4 | 1053 | 1378 |
| BANKBARODA | 259 | 18 | 236 | 305 |
| HAL | 4803 | 1 | 4322 | 5645 |
| IOC | 149.5 | 33 | 135 | 175 |
| JIOFIN | 300 | 16 | 269 | 373 |
| LT | 3670 | 2 | 3334 | 4245 |
| LUPIN | 1981 | 2 | 1798 | 2284 |
| TATAMOTORS | 718 | 7 | 641 | 894 |

|
||||
|---|---|---|---|---|
| Sector | CMP | Average | Stop Loss | Target |
| METAL | 2590 | 2480 | 2378 | 3078 |
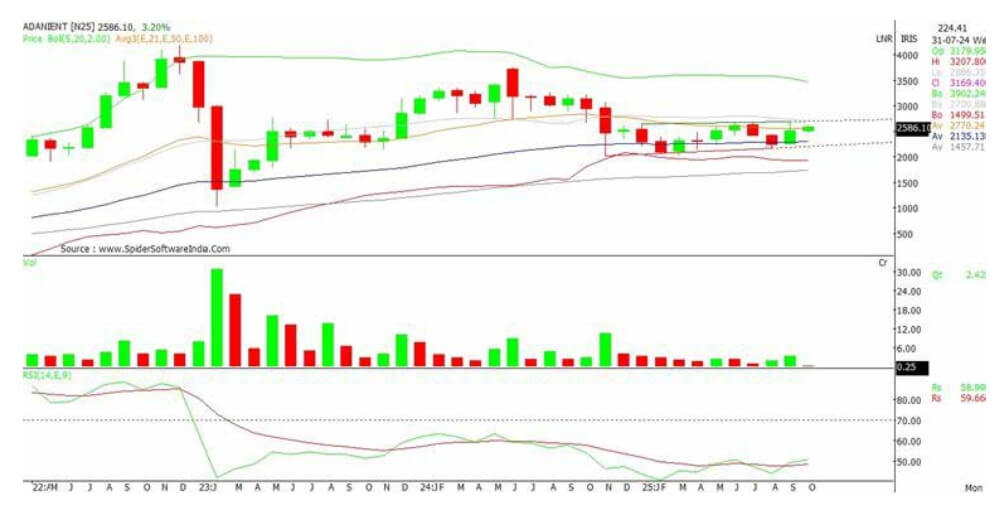
The stock has been of the preferred pick in the Metal & Mining space. The stock is trading above the 21, 50 and 100 DMA on the daily charts and is expected to gather momentum after the recent consolidation. The stock is expected to remain in the bullish zones in the coming months as well as per the current technical structure. The stock is expected to remain in the bullish zones in the coming months as well as per the current technical structure. The technical structure seems to be well poised to test 2900-3000 plus levels in the coming few quarters and may outperform the broader markets in long run.
| Technical Parameters | |||
|---|---|---|---|
| Moving averages (Weekly) | Support | Resistance | |
| 21-Day EMA | 2436 | 2510 | 2729 |
| 50-Day EMA | 2499 | 2480 | 2845 |
| 100-Day EMA | 2551 | 2378 | 3080 |
| Fundamental Parameters | |
|---|---|
| Market Capitalization (Rs. In Crores) | 2,99,054 |
| P/E Ratio | 84 |
| Promoter Holdings | 74% |
| FIIs Holdings | 11.5% |
| DIIs Holdings | 7% |
we recommend investors to enter the stock at the current levels for the above-mentioned targets keeping in place the stop loss given in the aforesaid data. The counter is expected to achieve the targets in the next few quarters.
Holding Period: 12 months

|
||||
|---|---|---|---|---|
| Sector | CMP | Average | Stop Loss | Target |
| PAINTS | 2335 | 2245 | 2156 | 2934 |
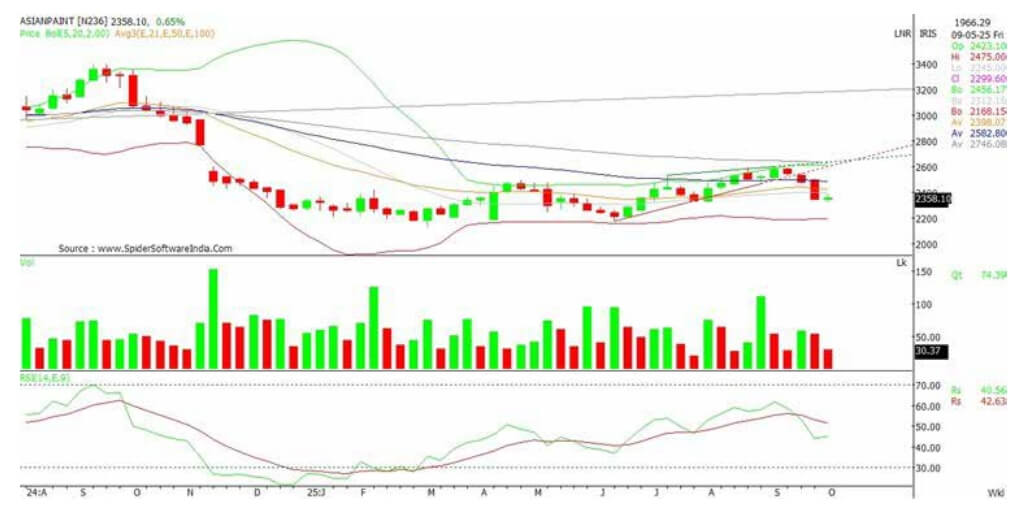
The Paint giant ASIANPAINT’s stock price is also in the good uptrend on the technical charts. The stock is trading around the cluster averages of 21, 50 and 100 DMA on the daily charts and is expected to gather momentum after the recent consolidation. In the long-term charts, the share after a strong up move has been in a consolidation mode from past few weeks and is now showing early signs of reversal from the crucial supports. The volumes in the recent consolidation have been very good indicating the stock is all set to move higher towards the targeted levels.
| Technical Parameters | |||
|---|---|---|---|
| Moving averages (Weekly) | Support | Resistance | |
| 21-Day EMA | 2425 | 2278 | 2532 |
| 50-Day EMA | 2487 | 2240 | 2865 |
| 100-Day EMA | 2630 | 2150 | 2940 |
| Fundamental Parameters | |
|---|---|
| Market Capitalization (Rs. In Crores) | 2,26,174 |
| P/E Ratio | 59 |
| Promoter Holdings | 53% |
| FIIs Holdings | 12% |
| DIIs Holdings | 21% |
The stock has been in the consolidative mode and have given breakout on the daily charts which indicates strong hands are accumulating the stock at current levels, which enhance the confidence over the stock.
Holding Period: 12 months

|
||||
|---|---|---|---|---|
| Sector | CMP | Average | Stop Loss | Target |
| BANKING | 1159 | 1084 | 1053 | 1378 |
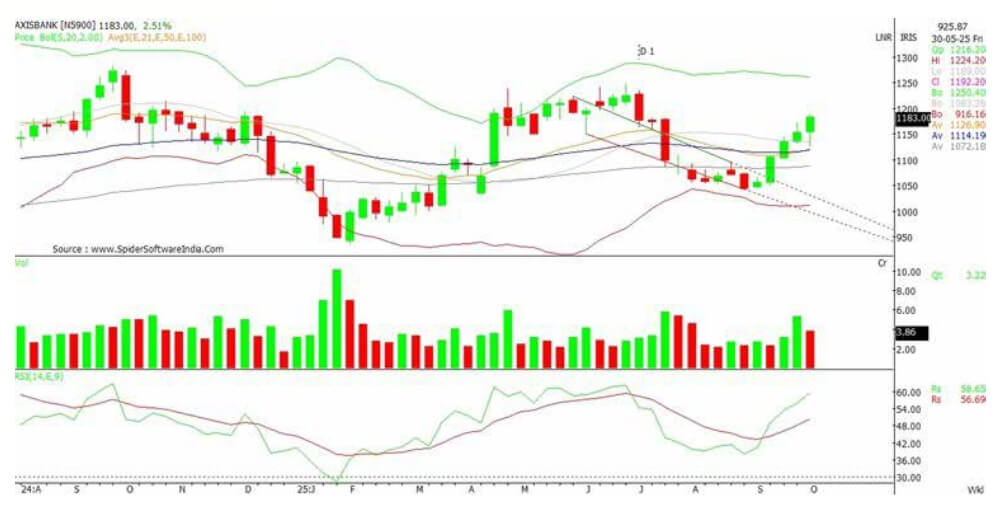
AXISBANK is one of our preferred stocks in the banking space and have recently gained good traction from the lower zones. The price is on the verge of breakout on the charts with strong volume actions in the recent past. The Bollinger Band (20,2) is showing bullish price expansion on the daily charts with overall volatility burst observed on the daily and weekly charts. On the other hand, the BFSI sector is looking very strong on the charts and may decline will be good buying opportunity for long term investors.
| Technical Parameters | |||
|---|---|---|---|
| Moving averages (Weekly) | Support | Resistance | |
| 21-Day EMA | 1121 | 1102 | 1203 |
| 50-Day EMA | 1119 | 1085 | 1312 |
| 100-Day EMA | 1088 | 1050 | 1380 |
| Fundamental Parameters | |
|---|---|
| Market Capitalization (Rs. In Crores) | 3,66,467 |
| P/E Ratio | 13 |
| Promoter Holdings | 8% |
| FIIs Holdings | 44% |
| DIIs Holdings | 41% |
The recent development in the stock suggests that the stock is well placed to take a fresh uphove in the coming months and long term investors may accumulate the stock from current zones.
Holding Period: 12 months

|
||||
|---|---|---|---|---|
| Sector | CMP | Average | Stop Loss | Target |
| BANKING | 259 | 243 | 236 | 305 |
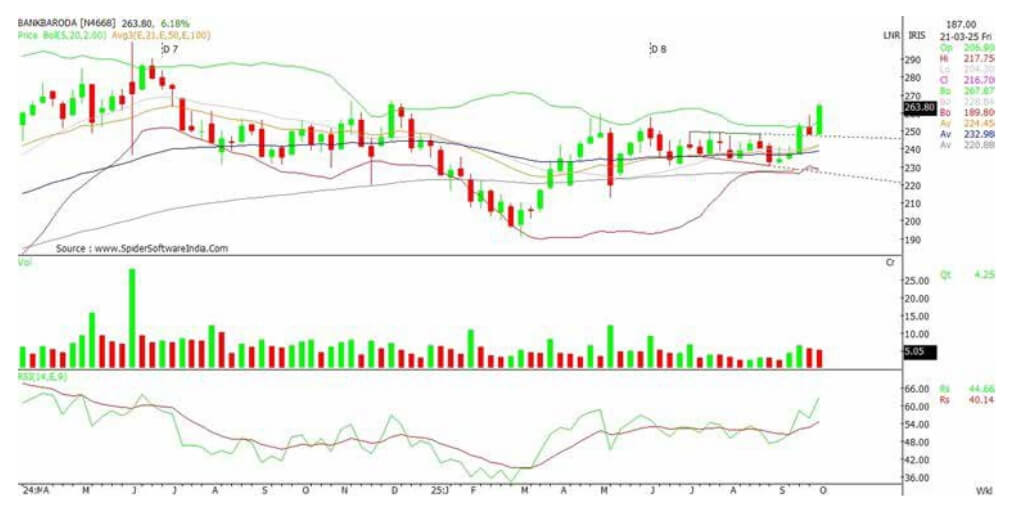
The stock is in the higher highs and higher lows cycle and is on the verge of breakout above the recent resistance levels on the daily charts. The stock is in the higher highs and higher lows cycle and is on the verge of breakout above the recent resistance levels on the daily charts. Among the leading indicators, Parabolic SAR and Heiken candlesticks indicate positive trend in daily chart as well as weekly chart. The Monthly as well as weekly charts are more convincing for a new up move with significant volume participation witnessed in the days gone by, indicating the stock is being accumulated by stronger hands on every dip.
| Technical Parameters | |||
|---|---|---|---|
| Moving averages (Weekly) | Support | Resistance | |
| 21-Day EMA | 242 | 251 | 282 |
| 50-Day EMA | 139 | 243 | 298 |
| 100-Day EMA | 129 | 235 | 305 |
| Fundamental Parameters | |
|---|---|
| Market Capitalization (Rs. In Crores) | 1,36,498 |
| P/E Ratio | 7 |
| Promoter Holdings | 64% |
| FIIs Holdings | 8% |
| DIIs Holdings | 19% |
The has been in the secular bull run from past few months and have given massive run on the daily charts in the last few months and is expected to continue the same for next few quarters. Long term investors may enter the stock from current zones
Holding Period: 12 months

|
||||
|---|---|---|---|---|
| Sector | CMP | Average | Stop Loss | Target |
| DEFENCE | 4803 | 4534 | 4322 | 5645 |
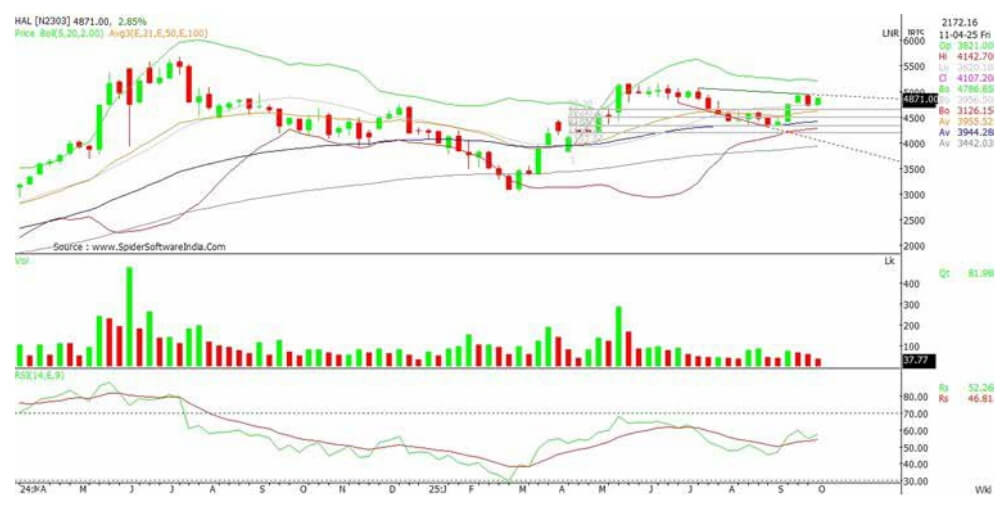
The stock is in the higher highs and higher lows cycle and is on the verge of breakout above the recent resistance levels on the daily charts. The stock is in the higher highs and higher lows cycle and is on the verge of breakout above the recent resistance levels on the daily charts. Among the leading indicators, Parabolic SAR and Heiken candlesticks indicate positive trend in daily chart as well as weekly chart. The Monthly as well as weekly charts are more convincing for a new up move with significant volume participation witnessed in the days gone by, indicating the stock is being accumulated by stronger hands on every dip.
| Technical Parameters | |||
|---|---|---|---|
| Moving averages (Weekly) | Support | Resistance | |
| 21-Day EMA | 4619 | 4703 | 4965 |
| 50-Day EMA | 4416 | 4644 | 5289 |
| 100-Day EMA | 3934 | 4540 | 5655 |
| Fundamental Parameters | |
|---|---|
| Market Capitalization (Rs. In Crores) | 3,25,720 |
| P/E Ratio | 39 |
| Promoter Holdings | 72% |
| FIIs Holdings | 12% |
| DIIs Holdings | 9% |
The defence theme is the flavour of the year and is expected to continue from the current zones as well and long term investors may bet on this stock for next 3-4 quarters.
Holding Period: 12 months

|
||||
|---|---|---|---|---|
| Sector | CMP | Average | Stop Loss | Target |
| OIL & GAS | 149.5 | 139 | 135 | 175 |
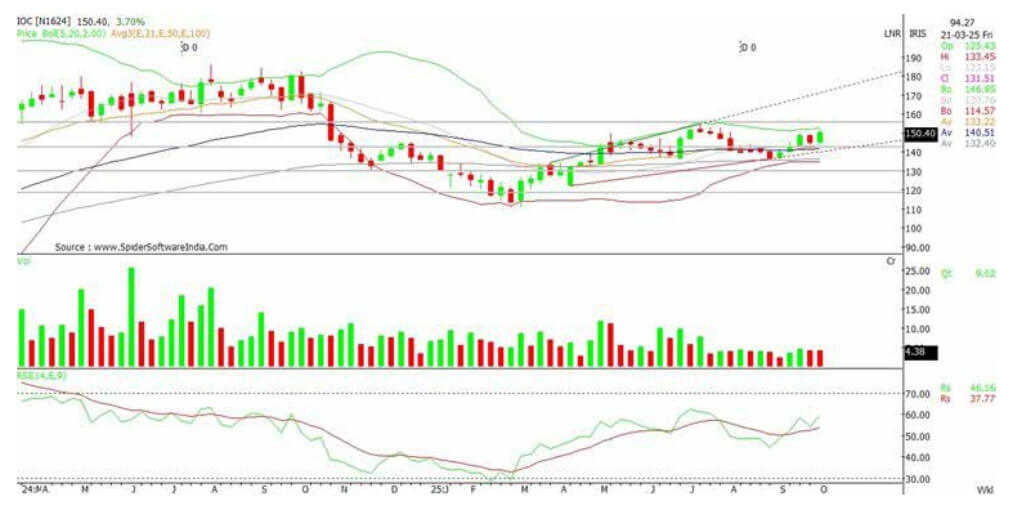
IOC has given strong consolidation breakout from the lower levels on the daily charts and is coupled with good trading volumes indicating positive momentum likely to continue in the medium-term period. The stock on daily, weekly and monthly charts is looking strong, also the stock is very well placed and trading above its moving averages of 200 DMA on daily charts. Holding our bullish view in the stock, we expect that the up move in the stock will remain intact and price is well placed to take it up move for upside target of 170 plus levels.
| Technical Parameters | |||
|---|---|---|---|
| Moving averages (Weekly) | Support | Resistance | |
| 21-Day EMA | 143 | 144 | 156 |
| 50-Day EMA | 142 | 140 | 166 |
| 100-Day EMA | 136 | 135 | 178 |
| Fundamental Parameters | |
|---|---|
| Market Capitalization (Rs. In Crores) | 2,12,369 |
| P/E Ratio | 12 |
| Promoter Holdings | 52% |
| FIIs Holdings | 7% |
| DIIs Holdings | 10% |
The counter has now crossed above its 20, 50, 100 and 200 DEMA on daily charts, indicating the strength in the stock. Long term traders should start accumulating the stock from current zones.
Holding Period: 12 months

|
||||
|---|---|---|---|---|
| Sector | CMP | Average | Stop Loss | Target |
| BFSI | 300 | 282 | 269 | 373 |
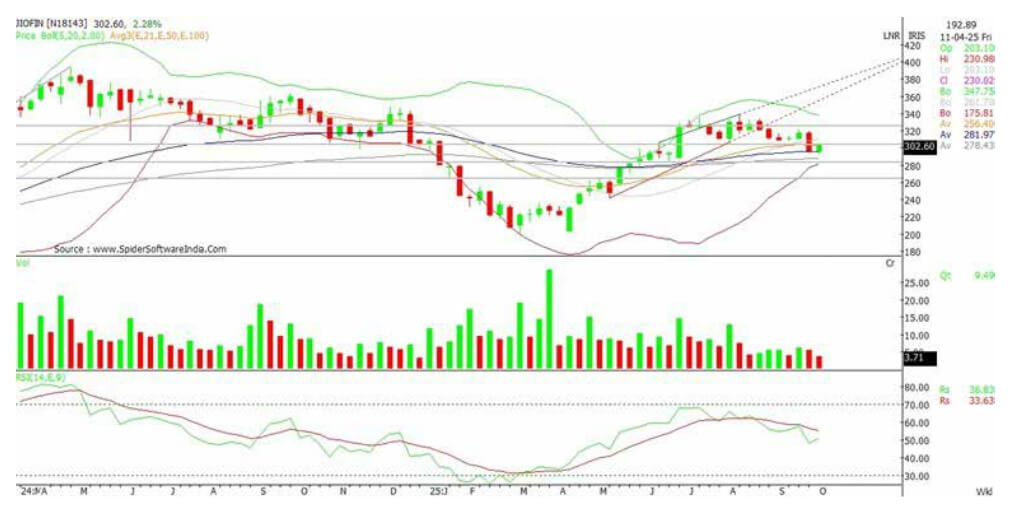
The stock has been in a strong uptrend from the past few months, consistently making higher highs and higher lows while at the same time respecting the major moving averages to take support for fresh breakouts. The MACD indicator has managed to hold above the zero level from the past few months in positive and negative crossovers which shows that the share has managed to continue its uptrend even with occasional pullbacks. The volume chart indicates that share has moved up steadily on strong volumes which adds to our conviction in this counter.
| Technical Parameters | |||
|---|---|---|---|
| Moving averages (Weekly) | Support | Resistance | |
| 21-Day EMA | 303 | 291 | 324 |
| 50-Day EMA | 296 | 281 | 352 |
| 100-Day EMA 287 | 270 | 375 | |
| Fundamental Parameters | |
|---|---|
| Market Capitalization (Rs. In Crores) | 1,91,679 |
| P/E Ratio | 120 |
| Promoter Holdings | 47% |
| FIIs Holdings | 12% |
| DIIs Holdings | 15% |
The counter has now crossed above its 20, 50, 100 and 200 DEMA on daily charts, indicating the strength in the stock with overall trend on the higher side on the long term trends.
Holding Period: 12 months

|
||||
|---|---|---|---|---|
| Sector | CMP | Average | Stop Loss | Target |
| INFRA | 3670 | 3422 | 3334 | 4245 |
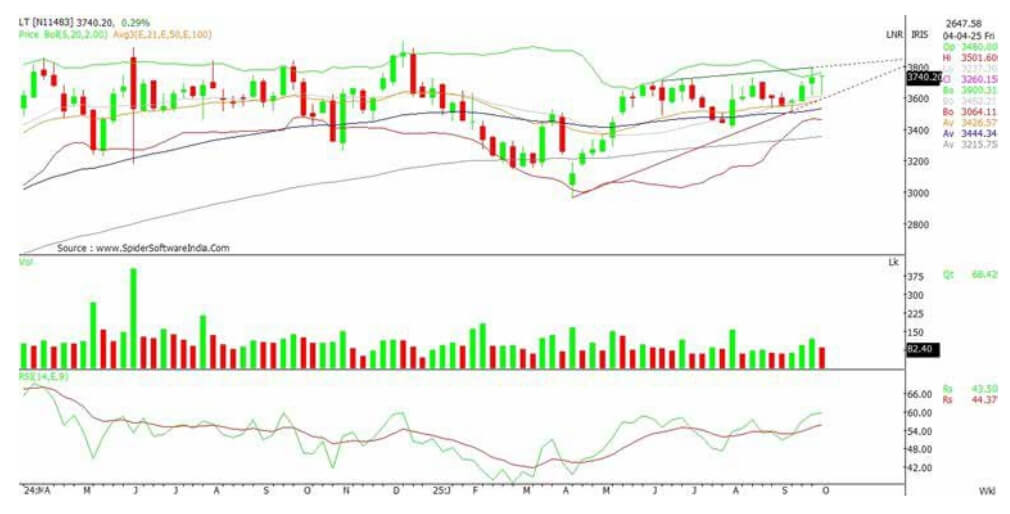
In the long-term charts, the share after a strong up move has been in a consolidation mode from past few weeks and is now showing early signs of reversal from the crucial supports. The share price in the consolidation phase has been respecting the major EMA’s on weekly basis which shows that the broad bullish trend being intact on a longer time frame. Among the leading indicators, Parabolic SAR and Heiken candlesticks indicate positive trend in daily chart as well as weekly chart. The stock price has managed to move above all the crucial moving averages of 20, 50, and 200 on a daily time frame.
| Technical Parameters | |||
|---|---|---|---|
| Moving averages (Weekly) | Support | Resistance | |
| 21-Day EMA | 3592 | 3512 | 3821 |
| 50-Day EMA | 3530 | 3430 | 4143 |
| 100-Day EMA | 3356 | 3335 | 4255 |
| Fundamental Parameters | |
|---|---|
| Market Capitalization (Rs. In Crores) | 5,13,509 |
| P/E Ratio | 33 |
| Promoter Holdings | - |
| FIIs Holdings | 19% |
| DIIs Holdings | 43% |
The recent development in the stock suggests that the stock is well placed to take it up move. Holding our bullish view in the stock and expecting that up move in the stock will remain intact.
Holding Period: 12 months

|
||||
|---|---|---|---|---|
| Sector | CMP | Average | Stop Loss | Target |
| PHARMA | 1981 | 1878 | 1798 | 2284 |
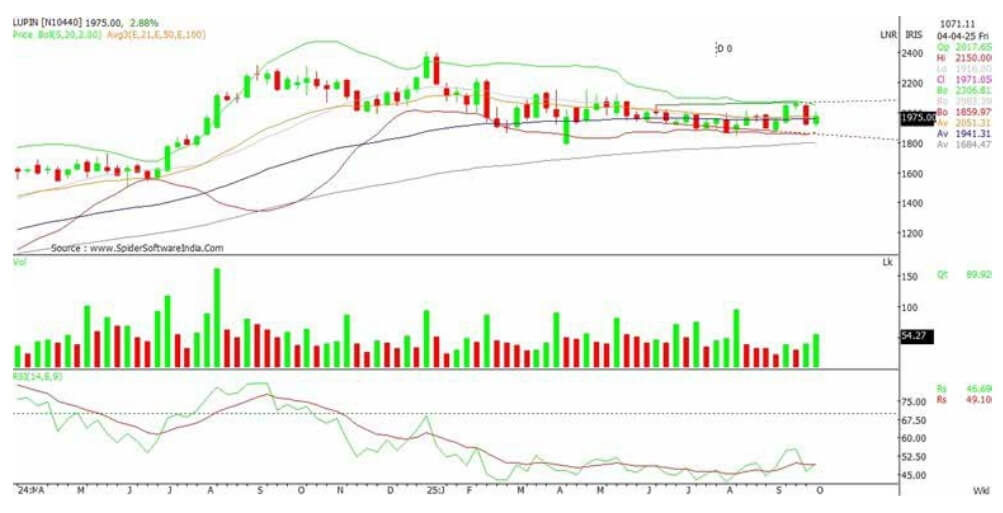
The share price has been in strong uptrend from the last few months and is now showing early signs of fresh breakout and a new bullish trend formation. The Bollinger Bands were in tight consolidation from past few sessions and are now indicating of strong up move that can be seen in this counter. Considering all the above data, we recommend traders to enter the stock at the current levels for the above-mentioned targets keeping in place the stop loss given in the aforesaid data. The counter is expected to achieve the targets in the next few quarters.
| Technical Parameters | |||
|---|---|---|---|
| Moving averages (Weekly) | Support | Resistance | |
| 21-Day EMA | 1972 | 1945 | 2084 |
| 50-Day EMA | 1957 | 1882 | 2168 |
| 100-Day EMA | 1799 | 1796 | 2287 |
| Fundamental Parameters | |
|---|---|
| Market Capitalization (Rs. In Crores) | 90,146 |
| P/E Ratio | 24 |
| Promoter Holdings | 47% |
| FIIs Holdings | 21% |
| DIIs Holdings | 26% |
The stock has been in the secular bull run from past few months and have given massive run on the daily charts in the last few months and is expected to continue the same.
Holding Period: 12 months

|
||||
|---|---|---|---|---|
| Sector | CMP | Average | Stop Loss | Target |
| AUTO | 718 | 668 | 641 | 894 |
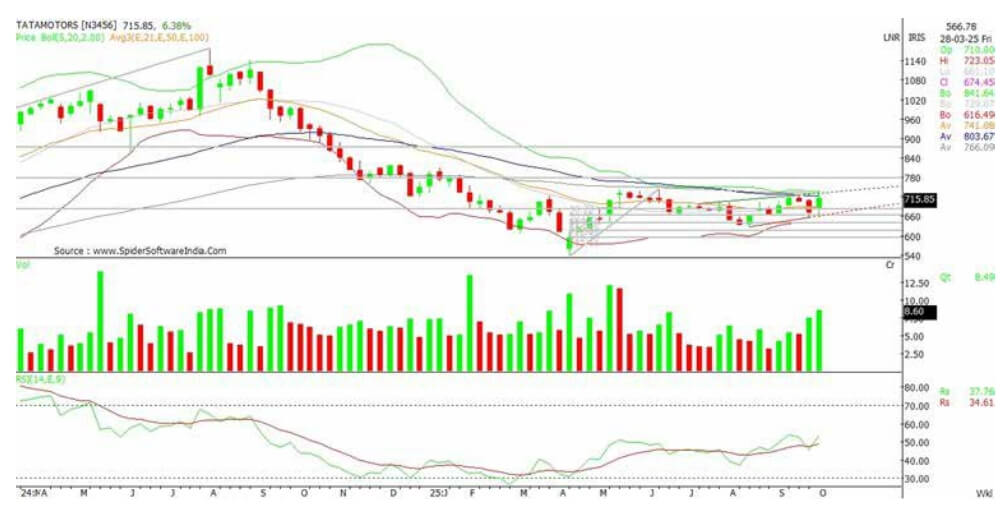
The stock has been major underperformer in the recent past but have given price volume consolidation at the lower levels indicating positive momentum in the coming days can be expected. On the weekly charts the stock is well placed near to its long-term moving averages indicating potential massive breakout on the higher side. The stock is also looking promising on the technical charts and may remain the preferred pick for the market participants in the coming weeks ahead of the volatile times.
| Technical Parameters | |||
|---|---|---|---|
| Moving averages (Weekly) | Support | Resistance | |
| 21-Day EMA | 690 | 687 | 772 |
| 50-Day EMA | 723 | 671 | 804 |
| 100-Day EMA | 730 | 640 | 898 |
| Fundamental Parameters | |
|---|---|
| Market Capitalization (Rs. In Crores) | 2,63,688 |
| P/E Ratio | 12 |
| Promoter Holdings | 43% |
| FIIs Holdings | 17% |
| DIIs Holdings | 17% |
The recent development in the stock suggests that the stock is well placed to take a fresh uphove in the coming months after the recent correction in the counter from the higher levels.
Disclosure: M/s. Bonanza Portfolio Ltd hereby declares that views expressed in this report accurately reflect the viewpoint subject to companies/securities.M/s. Bonanza Portfolio Ltd has taken reasonable care to achieve and maintain independence and objectivity in making any recommendations. The Analysts engaged in the preparation of this Report or his/her relative: - (a) do not have any financial interests in the subject company mentioned in this Report; (b) do not own 1% or more of the equity securities of the subject company mentioned in the report as of the last day of the month preceding the publication of the research report; (c) do not have any material conflict of interest at the time of publication of the Report. The Analysts engaged in the preparation of this Report: (a) have not received any compensation from the subject company in the past twelve months; (b) have not managed or co-managed public offering of securities for the subject company in the past twelve months; (c)have not received any compensation for investment banking or merchant banking or brokerage services from the subject company in the past twelve months; (d) have not received any compensation for products or services other than investment banking or merchant banking or brokerage services from the subject company in the past twelve months; (e) has not received any compensation or other benefits from the subject company or third party in connection with the Report; (f) has not served as an officer, director or employee of the subject company; (g) is not engaged in market making activity for the subject company. M/s. Bonanza Portfolio Ltd is a registered Research Analyst under the regulation of SEBI in the year 2014. The Regn No. INH100001666 and research analyst engaged in preparing reports is qualified as per the regulation's provision.
Disclaimer: This research report has been published by M/s. Bonanza Portfolio Ltd is meant solely for use by the recipient and is not for circulation. This document is for information purposes only, and information/opinions/views are not meant to serve as a professional investment guide for the readers. Reasonable care has been taken to ensure that information given at the time is believed to be fair and correct and opinions based thereupon are reasonable; due to the nature of research, it cannot be warranted or represented that it is accurate or complete and it should not be relied upon as such. If this report is inadvertently sent or has reached any individual, the same may be ignored and brought to the attention of the sender. Preparation of this research report does not constitute a personal recommendation or take into account the particular investment objectives, financial situations, or needs of individual clients. Past performance is not a guide for future performance. This Report has been prepared on the basis of publicly available information, internally developed data, and other sources believed to be reliable by Bonanza Portfolio Ltd. This report should not be taken as the only base for any market transaction; however, this data is a representation of one of the support documents, among other market risk criteria. The market participant can have an idea of the risk involved in using this information as the only source for any market-related activity. The distribution of this report in definite jurisdictions may be restricted by law, and persons in whose custody this report comes should observe any such restrictions. The revelation of interest statements integrated in this analysis are provided exclusively to improve & enhance the transparency and should not be treated as an endorsement of the views expressed in the analysis. The price and value of the investments referred to in this report and the income from them may go down as well as up. Bonanza Portfolio Ltd or its directors, employees, affiliates or representatives do not assume any responsibility for or warrant the accuracy, completeness, adequacy and reliability of such information/opinions/views. While due care has been taken to ensure that the disclosures and opinions given are fair and reasonable, none of the directors, employees, affiliates or representatives of M/s. Bonanza Portfolio Ltd shall be liable. Research reports may differ between M/s. Bonanza Portfolio Ltd RAs and other companies on account of differences in personal judgment and differences in time horizons for which recommendations are made. The research entity has not been engaged in market-making activities for the subject company. The research analyst has not served as an officer, director or employee of the subject company. Research analysts have not received any compensation/benefits from the Subject Company or third party in connection with the research report