
Date: July 12, 2024
Daily Technical Outlook
 Listen to this newsletter
Metals and Energy
Bullions Index
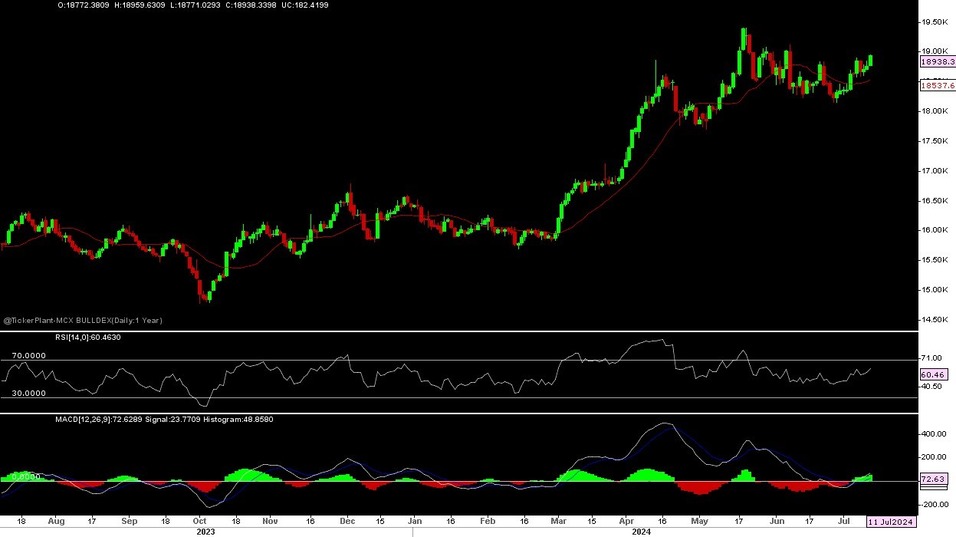
The Benchmark index witnessed a Minor Gap Opening on 11/7/24 and remained sideways to a small range, awaiting US CPI data. In the evening, after inflation fell more than forecast, the dollar index tumbled and a sharp rally was seen in bullion, resulting in the index closing near the day's high and well above the previous day's close.
Now, the index has Supported at 18750-550 - 18350; as a long hold, more upside is expected towards 19100-19200 in the short term. Other side only Sustain below 18350-18150 seen again 17800- 17700/Dn Rally in days to come. Price is trading above short term 13-days SMA and RSI at 60 mark with flat to upward slope indicates more room upside in the counter. Other side below zero line MACD seen selling at every Rally.
Metal Index
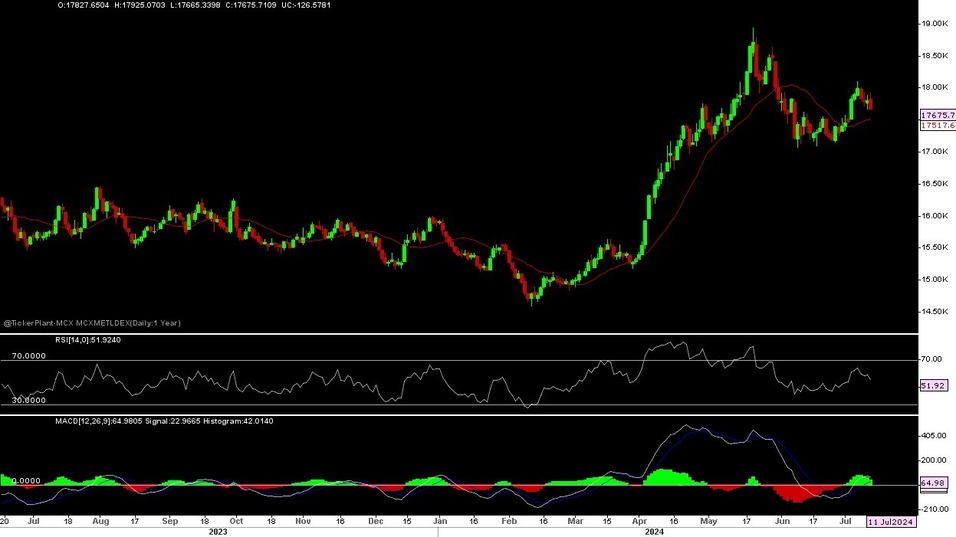
The Benchmark index seen a Minor Gap Up Opening on 11/7/24 but remain on lower side throughout the day as technical sell off after price fail to break resistance while hope from China stimulus not yet any impact makes sell off in base metals pack and resulted in index close near days low and well below over previous day closing.
Now index has a Support at 1450, as long hold, more Upside expected towards 18500-18600 in medium term. While on the lower side only sustain below 17450-17050 seen 16700-600 in days to come.
The price is trading above the short-term 13 SMA while the RSI is at 53 marks with an upward slope, which indicates more room for upside in the counter. On the other side, below the zero line, MACD also indicates more selling pressure at every rally.
Technical Levels
| Commodity | Contract Month | CLOSE | S1 | S2 | R1 | R2 | Trend |
|---|---|---|---|---|---|---|---|
| BULLIONS(Rs.) | |||||||
| Gold M | Aug | 72450 | 72150 | 72950 | 73150 | SIDEWAYS | |
| Silver M | Aug | 92000 | 91400 | 93700 | 94100 | BULLISH | |
| Energy | |||||||
| Crude Oil | July. | 6775 | 6720 | 6900 | 6940 | BEARISH | |
| Natural Gas | July. | 192 | 185 | 205 | 212 | BEARISH | |
| BASEMETALS | |||||||
| Copper | July. | 860 | 854 | 878 | 882 | BULLISH | |
| Zinc | July. | 271 | 267.5 | 276.0 | 277.5 | BULLISH | |
| Lead | July. | 187 | 185 | 191 | 193 | SIDEWAYS | |
| Nickel | July. | 1400 | 1350 | 1500 | 1550 | SIDEWAYS | |
Agri Morning Buzz
| Commodity (NCDX/MCX) | Downside Target | Stop loss (for sell trade) | Sell below | Buy above | Stop loss (for Buy trade) | Upside Target |
|---|---|---|---|---|---|---|
| GUARGUM (Aug) | 10600-10500 | 10950 | 10850 | 1090 | 10800 | 11100-11300 |
| JEERAUNJHA (Aug) | 27000-26700 | 27600 | 27500 | 28100 | 28000 | 28600-29000 |
| COCUDAKL (Aug) | 2880-2850 | 3030 | 3010 | 3080 | 3060 | 3120-3150 |
| CASTOR (Aug) | 5900-8700 | 6200 | 6100 | 6200 | 6100 | 6450-6600 |
| TURMERIC (Aug) | 15300-14200 | 157000 | 15600 | 15800 | 15700 | 160000-16200 |
Forex
Key Headlines
The Indian rupee against the US dollar ended marginally lower on Thursdaylagging most of the Asian peers, while dollar demand from importer banks while the recode high equity market attracted forelimb flows to support the rupee at the lower side and traded in a tight range through the day. The rupee at NSE Future on 29 July ended by 4 paise at 83.59 against the previous close of 83.55 after making a low of 83.53 and a high of 83.62. The rupee has maintained an under 10 paisa intra-day trading range so far in July.
Foreign investors have bought more than $10 billion of Indian government bonds that will be included in a widely followed JPMorgan debt index on 28 June, taking their ownership of such papers to a record high. In the nine months since JPMorgan said India's sovereign debt will be included in its emerging market debt index, foreign investors have bought 841 billion rupees ($10.08 billion) of eligible bonds on a net basis. Overseas buyers now own 1.79 trillion rupees of Indian bonds included in the so-called fully accessible route, which allows unfettered foreign purchases. A majority of these notes will be a part of the JPM index.
The dollar dropped on Thursday after data showed headline consumer prices unexpectedly fell in June, while a sharp gain in the Japanese yen sparked speculation of a possible intervention in the currency. The yen rose more than 2% at one point after falling to a 38-year low against the greenback last week. The dollar index was last down 0.49% at 104.45 and earlier reached 104.07, the lowest since 7 June. The euro rose 0.34% to $1.0867 and reached $1.090, the highest since 7 June. US consumer prices fell for the first time in four years in June amid cheaper gasoline and moderating rents, firmly putting disinflation back on track and drawing the Federal Reserve another step closer to cutting interest rates in September. Consumer price index falls 0.1% in June. CPI increases 3.0% year-on-year. Core CPI gains 0.1%; rises 3.3% year-on-year. Weekly jobless claims fall 17,000 to 222,000. Continuing claims declined by 4,000 to 1.852 million. UK GDP grew 0.4% in April, stronger than expected. Data further dampens expectations of a BoE cut in August. The upturn in the economy represents a boost for the new Labour government. Trade data show weak EU exports.
Bloomberg Index Services said it will include 34 Indian government bonds that are open for investment under the country's fully accessible route in its emerging market local currency indexes from January 2025. The announcement follows JP Morgan's decision to add Indian government bonds to its Government Bond Index-Emerging Markets from June 2024. Despite the hawkish shift in policymaker's expectations by FED, the odds of a September rate cut rose to about 77%, up from 63% earlier of this week, according to CME's FedWatch tool. A subsequent cut is expected by December.
| Currency | LTP | S1 | S2 | R1 | R2 | Trend |
|---|---|---|---|---|---|---|
| USDINR | 83.61 | 83.40 | 83.0 | 83.90 | 84.40 | SIDEWAYS |
| FUTURE | ||||||
| EURINR | 90.65 | 89.95 | 89.40 | 90.85 | 91.50 | BULLISH |
| FUTURE | ||||||
| GBPINR | 107.44 | 106.90 | 106.0 | 107.70 | 108.50 | BULLISH |
| FUTURE | ||||||
| JPYINR | 51.79 | 51.50 | 51.0 | 52.40 | 53.0 | BEARISH |
| FUTURE | ||||||
Derivative Report
- The market is indicating Short Covering due to a Combined OI decrease and increased in price.
- The Nifty FII LS ratio has dropped to 0.68 from the previous day's 0.70, indicating that the FII is currently adding a fresh short position.
- The monthly Nifty Put-Call Ratio is now at 1.43, showcasing increased put option activity
- Short Buildup (SB) is observed at 24400 CE followed by 24500 CE, whereas Short Buildup (SB) is seen at 24200 PE followed by 24300 PE, indicating a range-bound market sentiment
- The decrease in VIX from 14.43 to 13.99 indicates reduced volatility.
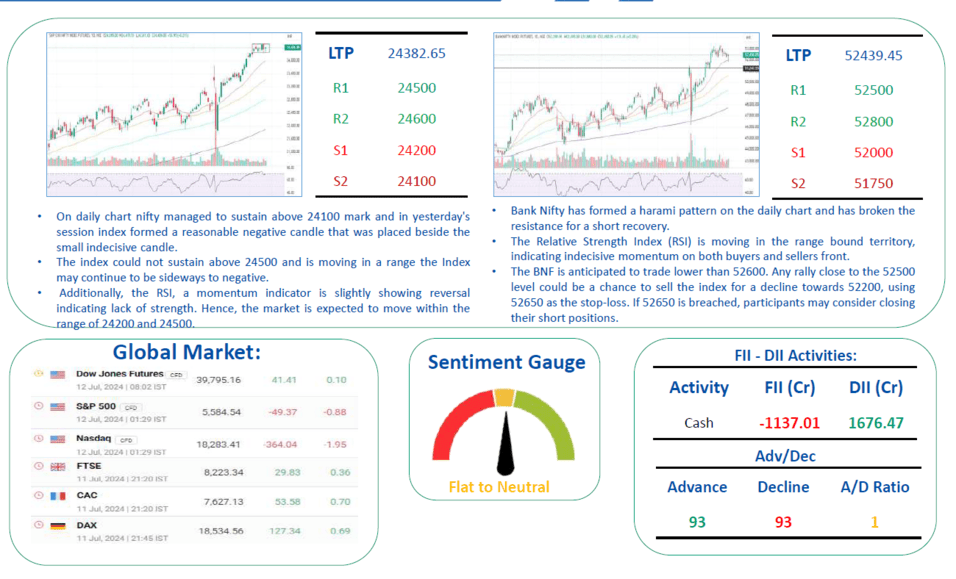
- The market is expected to move within the range of 24200 and 24500.
| SUPPORT | RESISTANCE | |
|---|---|---|
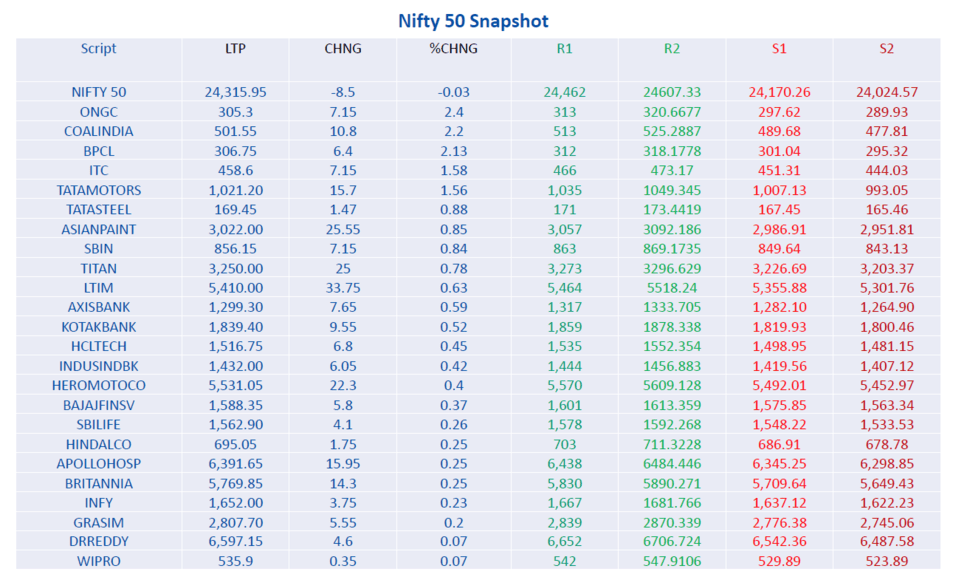
| NIFTY 50 | 24200-24100 | 24500-24600 |
| ADVANCE | DECLINE | AD RATIO | |
|---|---|---|---|
| NIFTY | 28 | 21 | 1.33 |
| NIFTY F&O | 93 | 93 | 1 |
| PRICE | OI | |
|---|---|---|
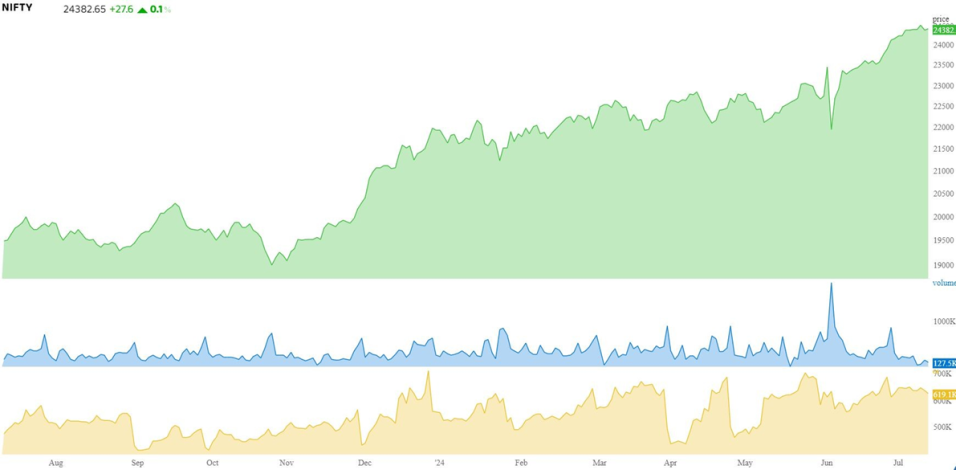
| Near | 24382.65 | 13634150 |
| Next | 24513.85 | 1584750 |
| Far | 24633.05 | 259425 |
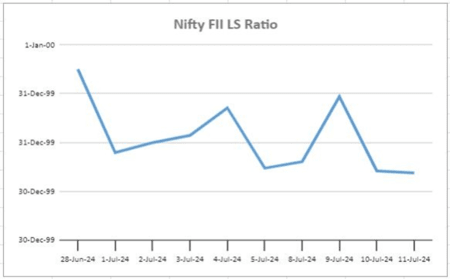
The Long Short Ratio for Nifty FII is currently 0.68, which is a decrease from the previous day, indicating that FIIs are initiating new short positions in Nifty.

The monthly Nifty PCR currently stands at 1.43, showing a higher level of PE activity.
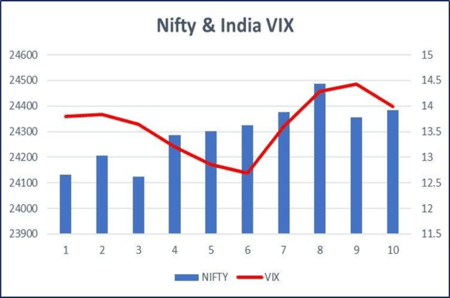
The decrease in VIX from 14.43 to 13.99 suggests a reduction in volatility. The current VIX level of 13.99 indicates a potential movement of 0.88% either upwards or downwards (1 standard deviation).
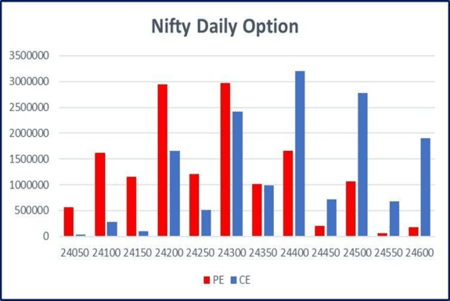
The highest CE activity was observed at 24400 & 24500, where fresh Short Buildup is evident. Similarly, on the PE side, the most activity occurred at 24300 & 24200, showing fresh Short Buildup.
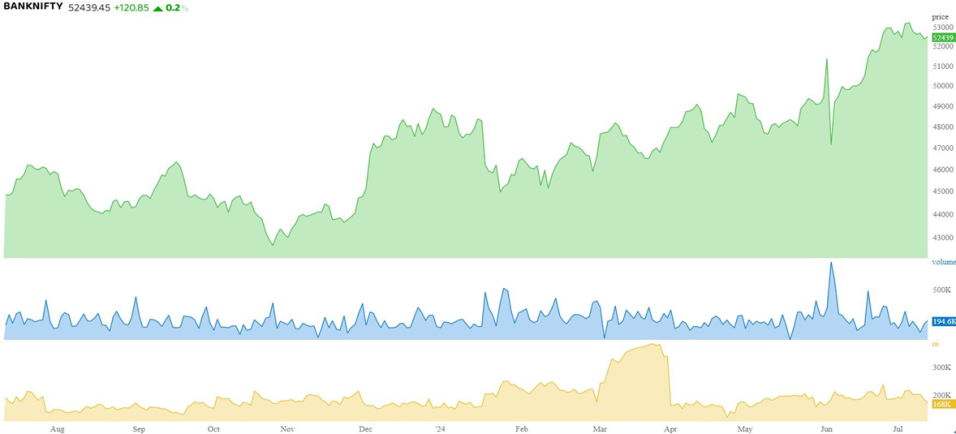
- The market is indicating Short Covering due to a Combined OI decrease and increase in price in BNF.
- Compared to the previous day's 0.34, the BNF FII LS ratio is currently at 0.46, suggesting that the FII’s have squared of their short position.
- The monthly Put-Call Ratio (PCR) has increased from 0.59 to 0.80. PCR of 0.8 indicates a tug-of-war between the PE and CE writers.
- BNF options see a surge in short call positions (highest at 52500 & 52300) and long put positions (highest at 52000 & 51900), suggesting potential market movement.
- The BNF is anticipated to trade lower than 52600. Any rally close to the 52500 level could be a chance to sell the index for a decline towards 52200, using 52650 as the stop-loss. If 52650 is breached, participants may consider closing their short positions.
| SUPPORT | RESISTANCE | |
|---|---|---|
| BNF | 52000-51750 | 52500-52800 |
| ADVANCE | DECLINE | |
|---|---|---|
| BNF | 10 | 22 |
| PRICE | OI | |
|---|---|---|
| Near | 52439.45 | 2178225 |
| Next | 52641.6 | 284490 |
| Far | 52930.75 | 57345 |
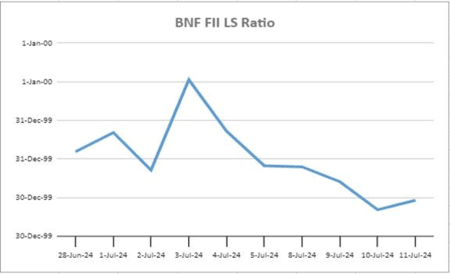
The BNF FII ratio is standing at 0.46 from the previous 0.34 which indicates short covering.
The BNF PCR has increased from 0.59 to 0.80, PCR below 1 indicates the majority of the participant in PE writing
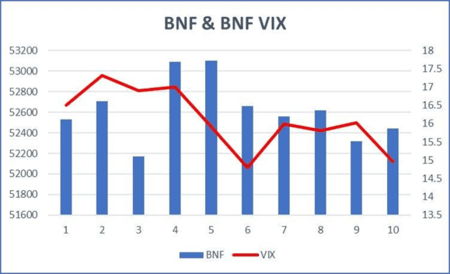
A decrease in VIX signifies lower market volatility, with a 1 standard deviation move expected to result in a 0.88% upside or downside based on VIX.
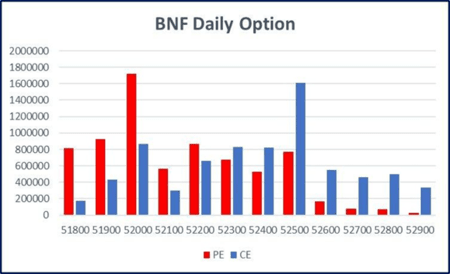
The BNF daily open interest shows the highest call option activity at 52500 & 52300 levels, indicating a significant increase in short positions. On the put option side, the highest open interest is at 52000 & 51900 levels, indicating a substantial increase in long positions.
Participant wise Future Index OI
| Participant | Long | Short | Ratio |
|---|---|---|---|
| Client | 277616 | 485702 | 0.571576 |
| DII | 77385 | 153975 | 0.502581 |
| FII | 425753 | 119261 | 3.569926 |
| Pro | 56542 | 78358 | 0.721585 |
Participant wise Future Stock OI
| Participant | Long | Short | Ratio |
|---|---|---|---|
| Client | 326108 | 2628834 | 7.06123 |
| DII | 3026855 | 3152394 | 0.04147 |
| FII | 1794035 | 4109726 | 1.29077 |
| Pro | 291797 | 986636 | 2.38124 |
Long Build-up
| Symbol | Price | Price (Chng%) | OI (Chng%) |
|---|---|---|---|
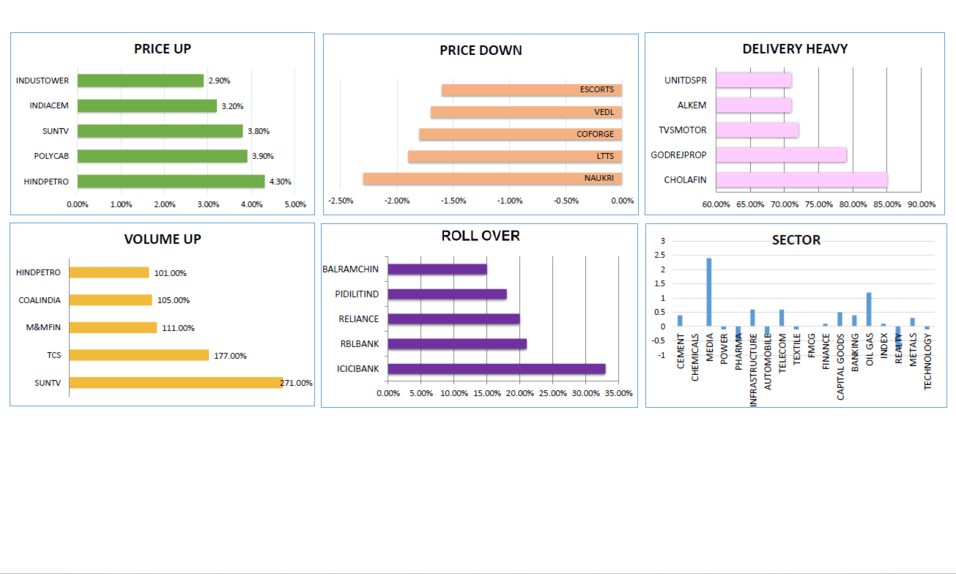
| SUN TV | 812.85 | 3.83% | 20.60% |
| TCS | 3933.8 | 0.54% | 11.14% |
| IOC | 175.18 | 1.78% | 8.76% |
| MANAPPURAM | 213.6 | 0.12% | 7.80% |
| MIDCAP NIFTY | 12417.95 | 0.15% | 7.16% |
Short Build-up
| Symbol | Price | Price (Chng%) | OI (Chng%) |
|---|---|---|---|
| SYNGENE | 724.8 | -0.50% | 8.35% |
| ZYDUSKIFE | 1169.5 | -1.48% | 5.63% |
| VEDL | 449.4 | -1.73% | 5.62% |
| TATACONSUM | 1136.1 | -1.40% | 5.24% |
| SHRIRAM FIN | 2736 | -0.88% | 5.04% |
Short Covering
| Symbol | Price | Price (Chng%) | OI (Chng%) |
|---|---|---|---|
| GLENMARK | 1385.2 | 0.20% | -17.94% |
| BALRAMCHIN | 445.55 | 1.92% | -10.03% |
| INDIACEM | 305.8 | 3.24% | -8.88% |
| BANK NIFTY | 52439.45 | 0.23% | -7.07% |
| POLYCAB | 6626.45 | 3.90% | –6.68% |
Long unwinding
| Symbol | Price | Price (Chng%) | OI (Chng%) |
|---|---|---|---|
| MFSL | 1033.65 | -0.54% | -4.72% |
| HCLTECH | 1503.85 | -0.01% | -4.05% |
| DIVISLAB | 4587.4 | -1.49% | -2.89% |
| NAVINFLUOR | 3656.9 | -0.72% | -2.40% |
| BAJAJ-AUTO | 9484.3 | -0.77% | -2.03% |
Security In Ban
| ABFRL | BANDHAN BANK | BALRAMCHIN | CHAMBLFERT | GNFC | IEX | INDIACEM | INDUS TOWERS |
| PEL | RBLBANK |
Market Mood

Download Bigul Trading App!
Supercharge your trading on the go with the Bigul Trading App! Download now for instant access to cutting-edge features, real-time insights, and unparalleled convenience.


FAQs
Discover all you need to know effortlessly with our frequently asked questions—your go-to resource for answers.