Candle trading strategy
Candlestick patterns play an important role in quantitative trading strategies due to their simple pattern formation and ease of understanding. This strategy requires only a basic understanding of how candlesticks are formed and also a few ideas about the several ways in which these candlesticks can be interpreted usefully.
However, if you are new to this strategy, this blog will help you obtain a complete understanding of candlesticks. Let us start with the basics.
Discussion about candlesticks
It is used in quantitative trading for interpreting the open, high, low, and close price fluctuations of the tradable instrument (security, derivative, currency, bond, etc.). The name comes from the fact that it appears to be in the shape of a real-life candlestick.
The candlesticks are distinguished by several colors:
- White or green candlesticks indicate an uptrend in the marketed instrument.
- Black or red candlesticks indicate a downtrend in the marketed instrument.
These strategies have different sizes, shapes, and even colors. The reason behind this is that the candlesticks are based on prices. Since the prices keep fluctuating, the size and shape of the candlesticks also change due to the nature of their anatomy. And that makes their strategies different. These distinct shapes and sizes are suggestive of market psychology, but, at times, they can be most effective in helping you to forecast the future market direction.
What are candlestick patterns?
Candlestick patterns are the graphical representations of price fluctuations, which are basically created by the open, high, low, and close prices of a financial instrument. These are used to discover trading patterns that technical analysts use to make trading decisions.
Also, sometimes you will identify similar-looking candlesticks or a group of the same appearing repeatedly, which can give you a particular trend for that time period.
These are quite popular chart patterns. Traders identify a variety of these in trading charts to predict stock price movement. Some of these are considered strong trend reversal signals, and so, when traders recognize them in trading charts, they design trading strategies around them. We have discussed several of the candlestick trading strategies in earlier blogs. So, in this blog, we are going to elaborate on the master candle strategy, a popular and universal trading strategy used in the FOREX market.
Among candlestick patterns, the engulfing patterns are quite popular and considered one of the strongest trend reversal indications. Master candles (MC) are also a type of engulfing candle. For those who are unfamiliar with the phrase “master candle,” it is a prominent long-body candle that creates a breakout.
A textbook master candle forms when an asset price fluctuates within a range, followed by four candles, all opening, and closing inside the body of the first (or the MC, which engulfs the opening and closing of the four specified candles). A master candle appears as a clear signal to a breakout point, and a master candle trading strategy includes planning a trade in the break.
In the foreign exchange market, a breakout is a point in the current trend that implies early signs of a potential trend change, allowing traders to take a position. It occurs when an asset’s price changes above the resistance line or below the support line with increased volume. A breakout trader will presume a long position when the price fluctuates above the resistance level and, conversely, move into a short position when the support line is violated.
A master candle is a significant breakout pattern, and the primary benefit is that it is bias-free. It indicates a breakout regardless of the ongoing market trend.
Developing a Trading Strategy with a Master Candle
The master candlestick trading strategy is a breakout trading strategy that allows you to identify a new range of price between the maximum and minimum of the candle. When the breakout occurs, we can expect the price to fluctuate significantly in the direction in which the breakout occurred. It is, therefore, important to incorporate this as a strategy in your FOREX trading.
A master candle is direction-neutral. So, when a master candle appears on the trading chart, the trader waits for confirmation candles to appear in either direction. The trader opens a position only after confirming it isn’t a bogus breakout.
Rules to follow while using the master candle trading strategy
- One primary rule that applies to the master candle is not to trade around the support or resistance.
- If the support or resistance is closer than the size of the MC, then restrain from trading.
- Place a stop loss in the adverse direction of the trend at the other end of the MC. For example, when entering a long position, the stop loss is set at the MC’s low.
- An ideal MC size is generally 30-150 pips (percentage in points), depending on the traded pair.
- If traders identify a candle that is too wide to maintain all the risk parameters, they usually place the stop in the middle of the MC.
- Avoid trading when the MC falls outside the pip range specified above.
- Traders usually place an order limit with a 5–10 pip buffer.
- Take a position when a candle breaks the high or low of the MC.
The thumb rules for entering long or short applying a master candle suggest the following.
When you are taking a long position, place a buy stop pending at five pips above the high of the MC, including the cost of the spread. However, when taking a short, the positions of the stop-buy limit are changed, and a stop-sell pending order is placed five pips below the lower point of the MC.
Candlestick Chart Patterns
Candlestick charts are the best way to know about investor sentiment and the relationship between demand and supply, bears and bulls, greed, fear, etc.
Traders must remember that while an individual candle gives sufficient information, patterns can be identified only by comparing one candle with its preceding and next candles. To gain from them, it is essential that traders understand patterns in candlestick charts. For better understanding, let’s split the patterns into two sections:
- Bullish patterns
- Bearish patterns
Both patterns are important for its analysis.
Bullish Patterns
Bullish patterns are subdivided into various types, which are as follows:
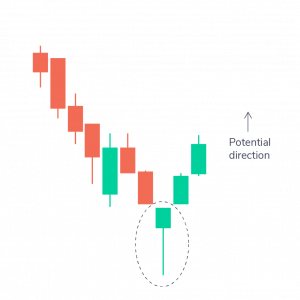
Hammer pattern
It is a candle with a small body and a large lower wick. It is normally located at the bottom of a downward trend. It expresses that, despite selling pressures, a strong buying surge forced the prices up. If the body is green, it signals a stronger bull market than a red body.
Inverse Hammer pattern
It is a candle with a small body and a large upper wick. It is usually placed at the bottom of a downward trend, too. It signals buying pressure followed by selling pressure. It also indicates that buyers will shortly have control.

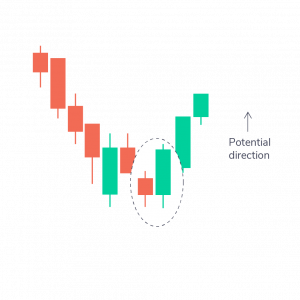
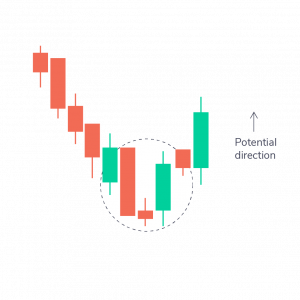
Bullish Engulfing pattern
This is a pattern of two candlesticks where one candle is a short red candle and the other is engulfed by a large green candle. It indicates a bullish market that forces the price up despite opening lower than the previous day.
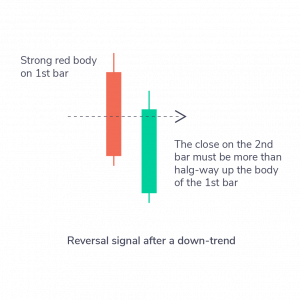
Piercing Line pattern
This is a two-candle pattern with a long red candle followed by a long green candle. Also, the losing price of the other candle needs to be higher than halfway up the body of the first candle. This implies strong buying pressure.

Morning Star pattern
This is a three-candle pattern with one short red candle, one long red candle, and one long green candle. There is normally no overlap between the short and long candles. This is an indication of the minimization of selling pressure and the beginning of a bull market.
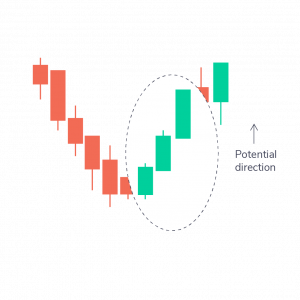
Three White Soldiers pattern
This is a three-candle trend that has three green candles with small wicks. These candles open and close higher than yesterday. After a downtrend, this is a strong signal of an upcoming bull trend.
Bearish Patterns
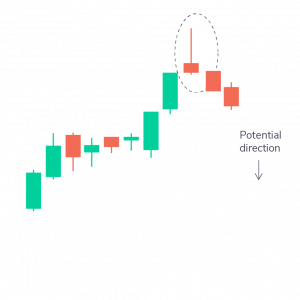
Hanging Man pattern
It is a candle with a small body and a large lower wick. It is normally located at the top of an upward trend. It indicates that the selling pressures outweighed the buying thrust. It also implies that bears are gaining control of the market.
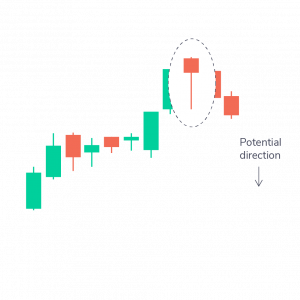
Shooting Star pattern
This is a candle that has a short body and a long upper wick. It is generally located at the top of an upward trend, too. Usually, the market opens higher than the previous one and rallies a bit before crashing like a shooting star. It implies that selling pressure is taking over the market.
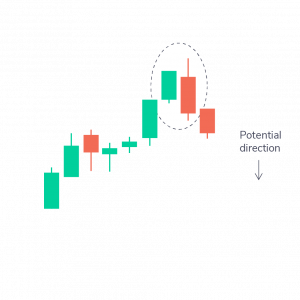
Bearish Engulfing pattern
In candlestick chart analysis, this is a pattern of two candlesticks where the shorter green one is engulfed by the larger red one. It normally occurs at the top of an upward trend. It implies a slowdown in the market’s rise and an upcoming downtrend. If the red candle is lower, then the downtrend is commonly more significant.
Evening Star pattern
This is a three-candle pattern with one short red candle, one long red candle, and one long green candle. There is normally no overlap between the short and long candles. This signals the reversal of an upward trend. This is more momentous if the third candle overcomes the gains of the first candle.
Three Black Crows pattern
This is a three-candle pattern that has all three respective red candles with short wicks. These candles open and close lower than yesterday. After an upward trend, this is a strong signal of an upcoming bear market.
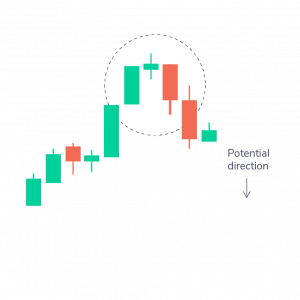
Chart patterns are an essential component of how to read a candle chart.
Conclusion
An MC can be used for any type of asset, but it works best for assets with higher volatility and strong fluctuations, like the FOREX market.
Trading with the signals of a master candle is one of the best straightforward trading strategies, but it isn’t without downsides. You need to search for false breakouts, which will result in unsuccessful trades. It is why more experienced traders avoid entering the market at the first entry after the creation of the master candle. They wait for the scouting parties to display, which are candle chart patterns that create a beachhead, to confirm the sustainability of the price change. In order to get more information about trading strategies, let’s connect with us.